

274
A. Kobal et al.
Table 1. I-test and correlation between B-Hg and U-Hg concentrations before and immediately after
exposure
I-test"
N
x
SO
P
Correlation
N
p
"Paired value
B-Hg (pg/l)
before-after
29
6.6-47.7
2.0-45.2
0.000
29
0.29
>0.05
hPostshift samples corrected for SG: 1.024.
U-Hg (pg!l)h
before-after
32
40.6-68.7
26.3-51.7
(l.000
32
0.68
0.000
SG (CV = 73%). The correlation between P-Hg and postshift U-Hg was higher
(r = 0.82, P = o.ooo, y = 1.357X* + 23.79; *P < 0 .001) than between E-Hg and
postshift U-Hg (r = 0.70, P = 0.002, Y = 2.862X* + 0 .965; * P < 0.001), if the
correction of U-Hg concentration to a UV of 1 ml/min was used (Fig. 5).
4
Discussion
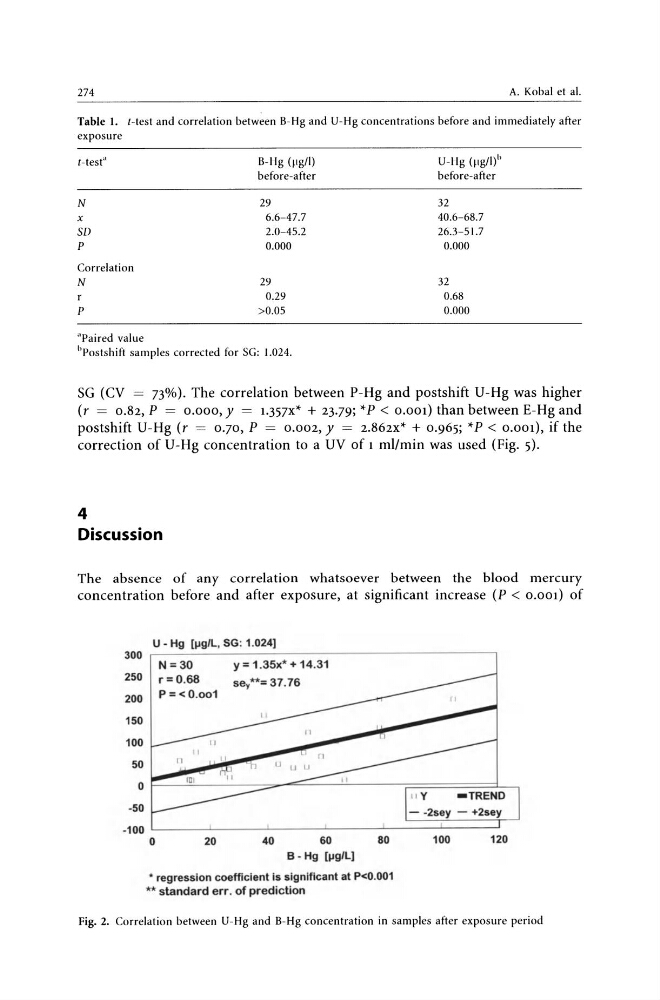
The absence of any correlation whatsoever between the blood mercury
concentration before and after exposure, at significant increase (P < 0.001) of
300
250
200
150
100
50
o
U - Hg [lIg/L, SG: 1. 024}
N=30
r = 0.68
P = < 0 . 001
y = 1 .35x* + 14.31
sey**=37.76
" y
-TREND
· 50
- .2sey - +2sey
.100 L_---1 _____ --'-___ --'===±====j-'
o
20
40
60
80
B· Hg [lIg/L}
• regression coeffiCient is significant at P<0.001
** standard err. of prediction
100
120
Fig. 2. Correlation between U-Hg and B-Hg concentration in samples after exposure period
A. Kobal et al.
Table 1. I-test and correlation between B-Hg and U-Hg concentrations before and immediately after
exposure
I-test"
N
x
SO
P
Correlation
N
p
"Paired value
B-Hg (pg/l)
before-after
29
6.6-47.7
2.0-45.2
0.000
29
0.29
>0.05
hPostshift samples corrected for SG: 1.024.
U-Hg (pg!l)h
before-after
32
40.6-68.7
26.3-51.7
(l.000
32
0.68
0.000
SG (CV = 73%). The correlation between P-Hg and postshift U-Hg was higher
(r = 0.82, P = o.ooo, y = 1.357X* + 23.79; *P < 0 .001) than between E-Hg and
postshift U-Hg (r = 0.70, P = 0.002, Y = 2.862X* + 0 .965; * P < 0.001), if the
correction of U-Hg concentration to a UV of 1 ml/min was used (Fig. 5).
4
Discussion
The absence of any correlation whatsoever between the blood mercury
concentration before and after exposure, at significant increase (P < 0.001) of
300
250
200
150
100
50
o
U - Hg [lIg/L, SG: 1. 024}
N=30
r = 0.68
P = < 0 . 001
y = 1 .35x* + 14.31
sey**=37.76
" y
-TREND
· 50
- .2sey - +2sey
.100 L_---1 _____ --'-___ --'===±====j-'
o
20
40
60
80
B· Hg [lIg/L}
• regression coeffiCient is significant at P<0.001
** standard err. of prediction
100
120
Fig. 2. Correlation between U-Hg and B-Hg concentration in samples after exposure period