

Evaluation of Internal Doses of Mercury at Intermittent Exposure to Elemental Mercury
273
3
Results
The Hgo concentration in the air of working areas in the pit was on average
0.22 ± 0.23 mg/m 3 . The Hgo concentration in inhaled air, measured for 9.0 ± 5.5
consecutive days in 15 miners using a personal sampler, was on average
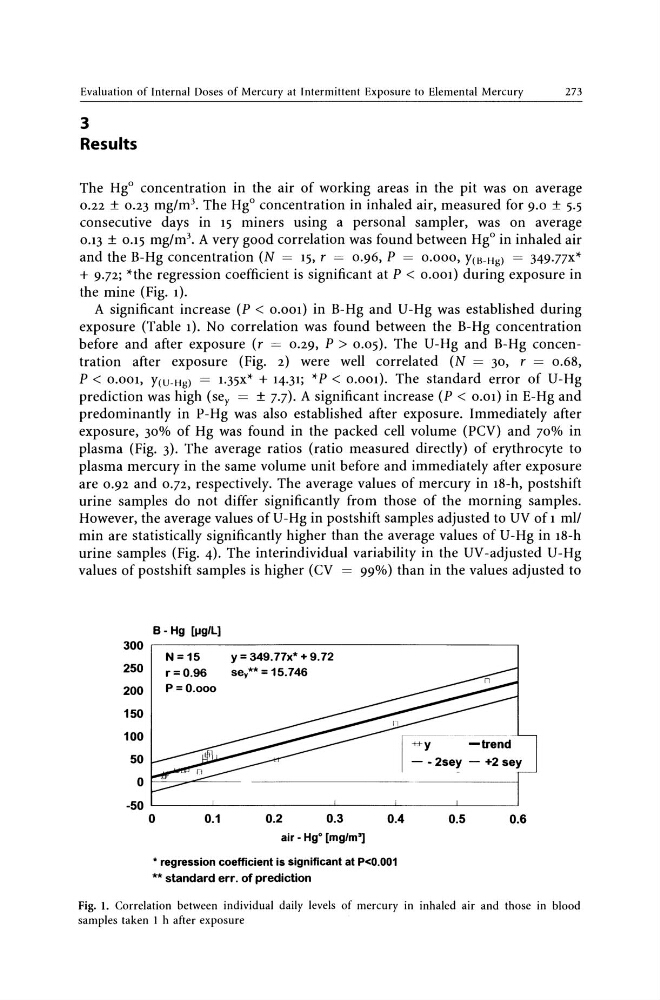
0.13 ± 0.15 mg/m3. A very good correlation was found between Hgo in inhaled air
and the B-Hg concentration (N = 15, r = 0.96, P = 0.000, y(B-Hg) = 349.77x*
+ 9.72; *the regression coefficient is significant at P < 0.001) during exposure in
the mine (Fig. 1).
A significant increase (P < 0.001) in B-Hg and U-Hg was established during
exposure (Table 1). No correlation was found between the B-Hg concentration
before and after exposure (r = 0.29, P> 0.05). The U-Hg and B-Hg concentration after exposure (Fig. 2) were well correlated (N = 30, r = 0.6S,
P < 0.001, y(U-Hg) = 1.35X* + 14.31; *P < 0.001). The standard error of U-Hg
prediction was high (se y = ± 7.7). A significant increase (P < 0.01) in E-Hg and
predominantly in P-Hg was also established after exposure. Immediately after
exposure, 30% of Hg was found in the packed cell volume (PCV) and 70% in
plasma (Fig. 3). The average ratios (ratio measured directly) of erythrocyte to
plasma mercury in the same volume unit before and immediately after exposure
are 0.92 and 0.72, respectively. The average values of mercury in IS-h, postshift
urine samples do not differ significantly from those of the morning samples.
However, the average values ofU-Hg in postshift samples adjusted to UV oft ml/
min are statistically significantly higher than the average values of U-Hg in Is-h
urine samples (Fig. 4). The interindividual variability in the UV-adjusted U-Hg
values of postshift samples is higher (CV = 99%) than in the values adjusted to
B - Hg [\lg/L]
300 ,-------------------------------------------,
N=15
250
r=0.96
200
P=O.ooo
150
100
50
y = 349.77x* + 9.72
sey**=15.746
o f--=---=-""'==-----~
-~~~~-~-~
-H-y
-trend
- - 2sey - +2 sey
-50 '----____ ____"__ ______ ~ _ _ ____"__ _ _ _ _L_ _ _ ____'_ _ _ ___'
o
0.1
0.2
0.3
0.4
air - Hgo [mg/m"]
• regression coefficient is significant at P
0.5
0.6
Fig. 1. Correlation between individual daily levels of mercury in inhaled air and those in blood
samples taken I h after exposure
273
3
Results
The Hgo concentration in the air of working areas in the pit was on average
0.22 ± 0.23 mg/m 3 . The Hgo concentration in inhaled air, measured for 9.0 ± 5.5
consecutive days in 15 miners using a personal sampler, was on average
0.13 ± 0.15 mg/m3. A very good correlation was found between Hgo in inhaled air
and the B-Hg concentration (N = 15, r = 0.96, P = 0.000, y(B-Hg) = 349.77x*
+ 9.72; *the regression coefficient is significant at P < 0.001) during exposure in
the mine (Fig. 1).
A significant increase (P < 0.001) in B-Hg and U-Hg was established during
exposure (Table 1). No correlation was found between the B-Hg concentration
before and after exposure (r = 0.29, P> 0.05). The U-Hg and B-Hg concentration after exposure (Fig. 2) were well correlated (N = 30, r = 0.6S,
P < 0.001, y(U-Hg) = 1.35X* + 14.31; *P < 0.001). The standard error of U-Hg
prediction was high (se y = ± 7.7). A significant increase (P < 0.01) in E-Hg and
predominantly in P-Hg was also established after exposure. Immediately after
exposure, 30% of Hg was found in the packed cell volume (PCV) and 70% in
plasma (Fig. 3). The average ratios (ratio measured directly) of erythrocyte to
plasma mercury in the same volume unit before and immediately after exposure
are 0.92 and 0.72, respectively. The average values of mercury in IS-h, postshift
urine samples do not differ significantly from those of the morning samples.
However, the average values ofU-Hg in postshift samples adjusted to UV oft ml/
min are statistically significantly higher than the average values of U-Hg in Is-h
urine samples (Fig. 4). The interindividual variability in the UV-adjusted U-Hg
values of postshift samples is higher (CV = 99%) than in the values adjusted to
B - Hg [\lg/L]
300 ,-------------------------------------------,
N=15
250
r=0.96
200
P=O.ooo
150
100
50
y = 349.77x* + 9.72
sey**=15.746
o f--=---=-""'==-----~
-~~~~-~-~
-H-y
-trend
- - 2sey - +2 sey
-50 '----____ ____"__ ______ ~ _ _ ____"__ _ _ _ _L_ _ _ ____'_ _ _ ___'
o
0.1
0.2
0.3
0.4
air - Hgo [mg/m"]
• regression coefficient is significant at P
0.5
0.6
Fig. 1. Correlation between individual daily levels of mercury in inhaled air and those in blood
samples taken I h after exposure