

226
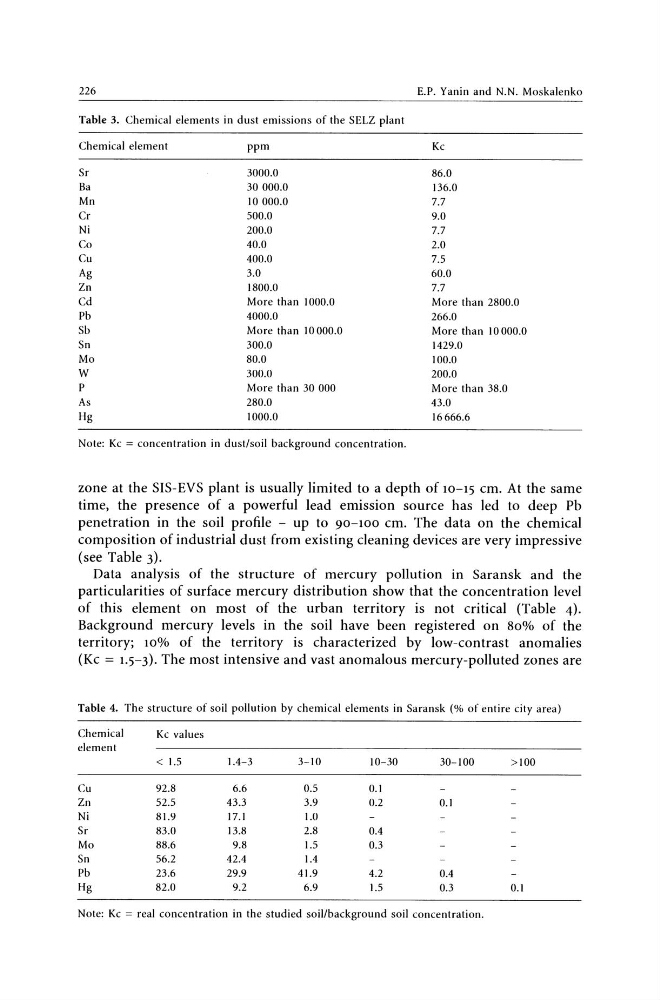
Table 3. Chemical elements in dust emissions of the SELZ plant
Chemical element
ppm
Sr
3000.0
Ba
30000.0
Mn
10 000.0
Cr
500.0
Ni
200.0
Co
40.0
Cu
400.0
Ag
3.0
Zn
1800.0
Cd
More than 1000.0
Pb
4000.0
Sb
More than 10 000.0
Sn
300.0
Mo
80.0
W
300.0
P
More than 30 000
As
280.0
Hg
1000.0
Note: Kc = concentration in dust/soil background concentration.
E.P. Yanin and N.N. Moskalenko
Kc
86.0
136.0
7.7
9.0
7.7
2.0
7.5
60.0
7.7
More than 2800.0
266.0
More than 10000.0
1429.0
100.0
200.0
More than 38.0
43.0
16666.6
zone at the SIS-EVS plant is usually limited to a depth of 10-15 cm. At the same
time, the presence of a powerful lead emission source has led to deep Pb
penetration in the soil profile - up to 90-100 cm. The data on the chemical
composition of industrial dust from existing cleaning devices are very impressive
(see Table 3).
Data analysis of the structure of mercury pollution in Saransk and the
particularities of surface mercury distribution show that the concentration level
of this element on most of the urban territory is not critical (Table 4).
Background mercury levels in the soil have been registered on 80% of the
territory; 10% of the territory is characterized by low-contrast anomalies
(Kc = 1.5-3). The most intensive and vast anomalous mercury-polluted zones are
Table 4. The structure of soil pollution by chemical elements in Saransk (% of entire city area)
Chemical
Kc values
element
< 1.5
1.4-3
3-10
10-30
30-100
>100
eu
92.8
6.6
0.5
0.1
Zn
52.5
43.3
3.9
0.2
0.1
Ni
81.9
17.1
1.0
Sr
83.0
13.8
2.8
0.4
Mo
88.6
9.8
1.5
0.3
Sn
56.2
42.4
1.4
Pb
23.6
29.9
41.9
4.2
0.4
Hg
82.0
9.2
6.9
1.5
0.3
0.1
Note: Kc = real concentration in the studied soil/background soil concentration.
Table 3. Chemical elements in dust emissions of the SELZ plant
Chemical element
ppm
Sr
3000.0
Ba
30000.0
Mn
10 000.0
Cr
500.0
Ni
200.0
Co
40.0
Cu
400.0
Ag
3.0
Zn
1800.0
Cd
More than 1000.0
Pb
4000.0
Sb
More than 10 000.0
Sn
300.0
Mo
80.0
W
300.0
P
More than 30 000
As
280.0
Hg
1000.0
Note: Kc = concentration in dust/soil background concentration.
E.P. Yanin and N.N. Moskalenko
Kc
86.0
136.0
7.7
9.0
7.7
2.0
7.5
60.0
7.7
More than 2800.0
266.0
More than 10000.0
1429.0
100.0
200.0
More than 38.0
43.0
16666.6
zone at the SIS-EVS plant is usually limited to a depth of 10-15 cm. At the same
time, the presence of a powerful lead emission source has led to deep Pb
penetration in the soil profile - up to 90-100 cm. The data on the chemical
composition of industrial dust from existing cleaning devices are very impressive
(see Table 3).
Data analysis of the structure of mercury pollution in Saransk and the
particularities of surface mercury distribution show that the concentration level
of this element on most of the urban territory is not critical (Table 4).
Background mercury levels in the soil have been registered on 80% of the
territory; 10% of the territory is characterized by low-contrast anomalies
(Kc = 1.5-3). The most intensive and vast anomalous mercury-polluted zones are
Table 4. The structure of soil pollution by chemical elements in Saransk (% of entire city area)
Chemical
Kc values
element
< 1.5
1.4-3
3-10
10-30
30-100
>100
eu
92.8
6.6
0.5
0.1
Zn
52.5
43.3
3.9
0.2
0.1
Ni
81.9
17.1
1.0
Sr
83.0
13.8
2.8
0.4
Mo
88.6
9.8
1.5
0.3
Sn
56.2
42.4
1.4
Pb
23.6
29.9
41.9
4.2
0.4
Hg
82.0
9.2
6.9
1.5
0.3
0.1
Note: Kc = real concentration in the studied soil/background soil concentration.