

Monitoring and Assessment of Mercury Pollution
225
Nevertheless, the Lisma electrical engineering plants are the main source of
mercury and heavy metal pollution in Saransk. Furthermore, the intensity of the
city's contamination by chemical elements contained in emissions, sewage and
waste of electrical engineering plants is no less than the intensity of mercury
contamination. It is clear that the composition of technogenic anomalies in
different environmental media depends on the synergistic impact of a whole
range of plants. The specific impact of electrical engineering plants may be
accurately fixed.
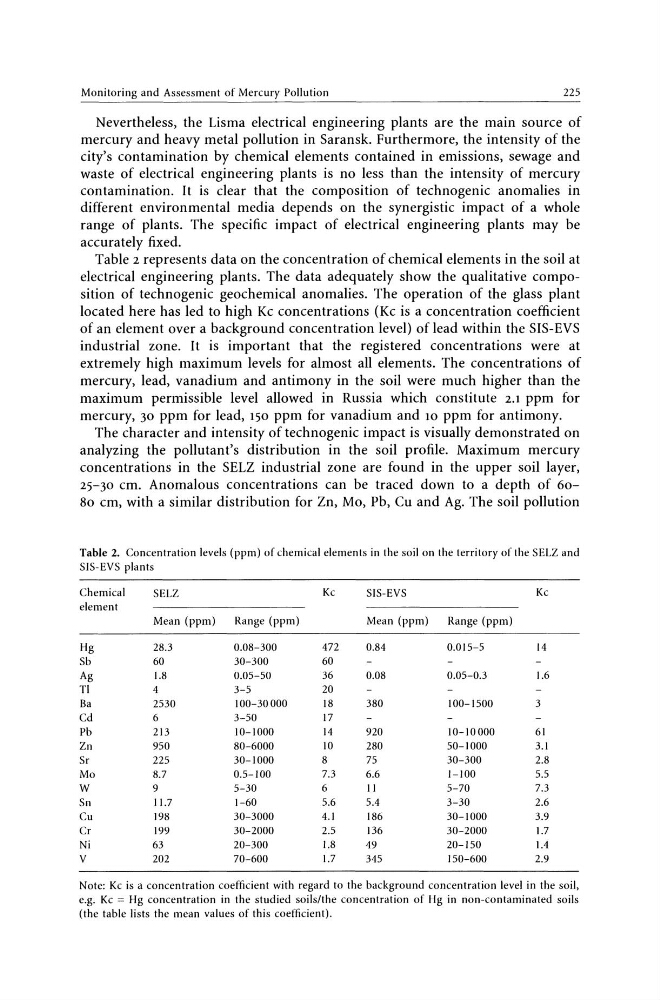
Table 2 represents data on the concentration of chemical elements in the soil at
electrical engineering plants. The data adequately show the qualitative composition of techno genic geochemical anomalies. The operation of the glass plant
located here has led to high Kc concentrations (Kc is a concentration coefficient
of an element over a background concentration level) of lead within the SIS-EVS
industrial zone. It is important that the registered concentrations were at
extremely high maximum levels for almost all elements. The concentrations of
mercury, lead, vanadium and antimony in the soil were much higher than the
maximum permissible level allowed in Russia which constitute 2.1 ppm for
mercury, 30 ppm for lead, 150 ppm for vanadium and 10 ppm for antimony.
The character and intensity of technogenic impact is visually demonstrated on
analyzing the pollutant's distribution in the soil profile. Maximum mercury
concentrations in the SELZ industrial zone are found in the upper soil layer,
25-30 cm. Anomalous concentrations can be traced down to a depth of 6080 cm, with a similar distribution for Zn, Mo, Pb, Cu and Ag. The soil pollution
Table 2. Concentration levels (ppm) of chemical elements in the soil on the territory of the SELZ and
SIS-EVS plants
Chemical
SELZ
Kc
SIS-EVS
Kc
element
Mean (ppm)
Range (ppm)
Mean (ppm)
Range (ppm)
Hg
28.3
0.08-300
472
0.84
0.015-5
14
Sb
60
30-300
60
Ag
1.8
0.05-50
36
0.08
0.05-0.3
1.6
Tl
4
3-5
20
Ba
2530
100-30000
18
380
100-1500
3
Cd
6
3-50
17
Pb
213
10-1000
14
920
10-10000
61
Zn
950
80-6000
10
280
50-1000
3.1
Sr
225
30-1000
8
75
30-300
2.8
Mo
8.7
0.5-100
7.3
6.6
1-100
5.5
W
9
5-30
6
II
5-70
7.3
Sn
11.7
1-60
5.6
5.4
3-30
2.6
Cu
198
30-3000
4.1
186
30-1000
3.9
Cr
199
30-2000
2.5
136
30-2000
1.7
Ni
63
20-300
1.8
49
20-150
1.4
V
202
70-600
1.7
345
150-600
2.9
Note: Kc is a concentration coefficient with regard to the background concentration level in the soil,
e.g. Kc = Hg concentration in the studied soils/the concentration of Hg in non-contaminated soils
(the table lists the mean values of this coetlicient).
225
Nevertheless, the Lisma electrical engineering plants are the main source of
mercury and heavy metal pollution in Saransk. Furthermore, the intensity of the
city's contamination by chemical elements contained in emissions, sewage and
waste of electrical engineering plants is no less than the intensity of mercury
contamination. It is clear that the composition of technogenic anomalies in
different environmental media depends on the synergistic impact of a whole
range of plants. The specific impact of electrical engineering plants may be
accurately fixed.
Table 2 represents data on the concentration of chemical elements in the soil at
electrical engineering plants. The data adequately show the qualitative composition of techno genic geochemical anomalies. The operation of the glass plant
located here has led to high Kc concentrations (Kc is a concentration coefficient
of an element over a background concentration level) of lead within the SIS-EVS
industrial zone. It is important that the registered concentrations were at
extremely high maximum levels for almost all elements. The concentrations of
mercury, lead, vanadium and antimony in the soil were much higher than the
maximum permissible level allowed in Russia which constitute 2.1 ppm for
mercury, 30 ppm for lead, 150 ppm for vanadium and 10 ppm for antimony.
The character and intensity of technogenic impact is visually demonstrated on
analyzing the pollutant's distribution in the soil profile. Maximum mercury
concentrations in the SELZ industrial zone are found in the upper soil layer,
25-30 cm. Anomalous concentrations can be traced down to a depth of 6080 cm, with a similar distribution for Zn, Mo, Pb, Cu and Ag. The soil pollution
Table 2. Concentration levels (ppm) of chemical elements in the soil on the territory of the SELZ and
SIS-EVS plants
Chemical
SELZ
Kc
SIS-EVS
Kc
element
Mean (ppm)
Range (ppm)
Mean (ppm)
Range (ppm)
Hg
28.3
0.08-300
472
0.84
0.015-5
14
Sb
60
30-300
60
Ag
1.8
0.05-50
36
0.08
0.05-0.3
1.6
Tl
4
3-5
20
Ba
2530
100-30000
18
380
100-1500
3
Cd
6
3-50
17
Pb
213
10-1000
14
920
10-10000
61
Zn
950
80-6000
10
280
50-1000
3.1
Sr
225
30-1000
8
75
30-300
2.8
Mo
8.7
0.5-100
7.3
6.6
1-100
5.5
W
9
5-30
6
II
5-70
7.3
Sn
11.7
1-60
5.6
5.4
3-30
2.6
Cu
198
30-3000
4.1
186
30-1000
3.9
Cr
199
30-2000
2.5
136
30-2000
1.7
Ni
63
20-300
1.8
49
20-150
1.4
V
202
70-600
1.7
345
150-600
2.9
Note: Kc is a concentration coefficient with regard to the background concentration level in the soil,
e.g. Kc = Hg concentration in the studied soils/the concentration of Hg in non-contaminated soils
(the table lists the mean values of this coetlicient).