

216
R.V. Marins et al.
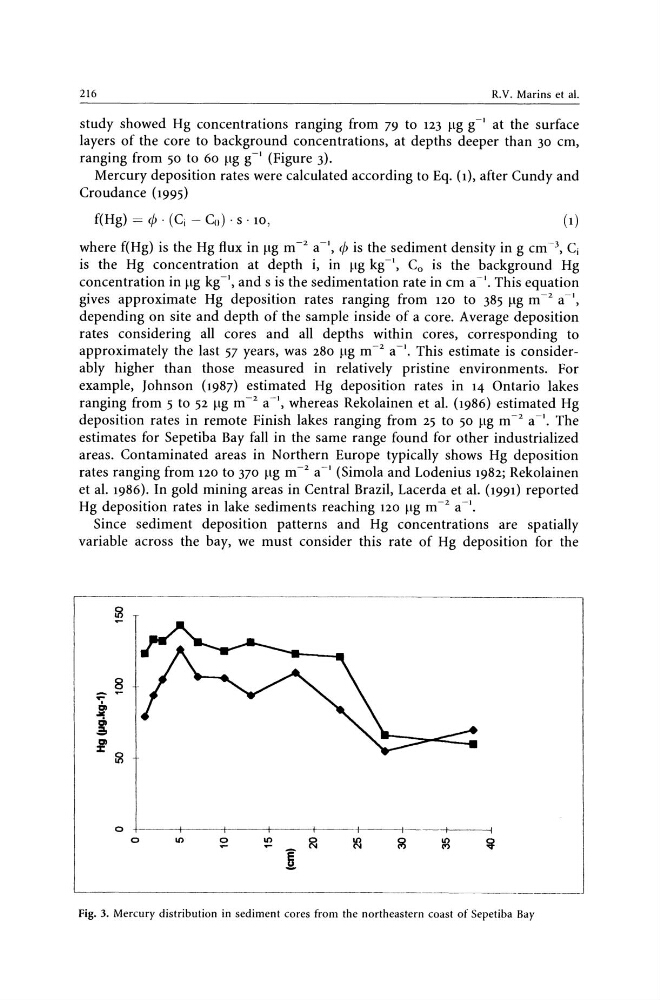
study showed Hg concentrations ranging from 79 to 123 ~lg g -I at the surface
layers of the core to background concentrations, at depths deeper than 30 cm,
ranging from 50 to 60 ~lg g-I (Figure 3).
Mercury deposition rates were calculated according to Eq. (1), after Cundy and
Croudance (1995)
f(Hg) = (1)
where f(Hg) is the Hg flux in ~lg m- 2 a-I, is the Hg concentration at depth i, in ~lg kg -I, CO is the background Hg
concentration in ~lg kg -" and s is the sedimentation rate in cm a -I. This equation
gives approximate Hg deposition rates ranging from 120 to 385 ~lg m -2 a-"
depending on site and depth of the sample inside of a core. Average deposition
rates considering all cores and all depths within cores, corresponding to
approximately the last 57 years, was 280 ~lg m -2 a -I. This estimate is considerably higher than those measured in relatively pristine environments. For
example, Johnson (1987) estimated Hg deposition rates in 14 Ontario lakes
ranging from 5 to 52 ~lg m -2 a -I, whereas Rekolainen et al. (1986) estimated Hg
deposition rates in remote Finish lakes ranging from 25 to 50 ~lg m- 2 a-I. The
estimates for Sepetiba Bay fall in the same range found for other industrialized
areas. Contaminated areas in Northern Europe typically shows Hg deposition
rates ranging from 120 to 370 ~lg m- 2 a-I (Simola and Lodenius 1982; Rekolainen
et al. 1986). In gold mining areas in Central Brazil, Lacerda et al. (1991) reported
Hg deposition rates in lake sediments reaching 120 ~lg m- 2 a-I.
Since sediment deposition patterns and Hg concentrations are spatially
variable across the bay, we must consider this rate of Hg deposition for the
- - - - - - - - - - - - - - - - - - - - - - - _ . _ - - - - - -
0
I - -
I
I
--+---1
0
U')
0
U')
~
~
~
~
~
~
!
Fig. 3. Mercury distribution in sediment cores from the northeastern coast of Sepetiba Bay
R.V. Marins et al.
study showed Hg concentrations ranging from 79 to 123 ~lg g -I at the surface
layers of the core to background concentrations, at depths deeper than 30 cm,
ranging from 50 to 60 ~lg g-I (Figure 3).
Mercury deposition rates were calculated according to Eq. (1), after Cundy and
Croudance (1995)
f(Hg) = (1)
where f(Hg) is the Hg flux in ~lg m- 2 a-I, is the Hg concentration at depth i, in ~lg kg -I, CO is the background Hg
concentration in ~lg kg -" and s is the sedimentation rate in cm a -I. This equation
gives approximate Hg deposition rates ranging from 120 to 385 ~lg m -2 a-"
depending on site and depth of the sample inside of a core. Average deposition
rates considering all cores and all depths within cores, corresponding to
approximately the last 57 years, was 280 ~lg m -2 a -I. This estimate is considerably higher than those measured in relatively pristine environments. For
example, Johnson (1987) estimated Hg deposition rates in 14 Ontario lakes
ranging from 5 to 52 ~lg m -2 a -I, whereas Rekolainen et al. (1986) estimated Hg
deposition rates in remote Finish lakes ranging from 25 to 50 ~lg m- 2 a-I. The
estimates for Sepetiba Bay fall in the same range found for other industrialized
areas. Contaminated areas in Northern Europe typically shows Hg deposition
rates ranging from 120 to 370 ~lg m- 2 a-I (Simola and Lodenius 1982; Rekolainen
et al. 1986). In gold mining areas in Central Brazil, Lacerda et al. (1991) reported
Hg deposition rates in lake sediments reaching 120 ~lg m- 2 a-I.
Since sediment deposition patterns and Hg concentrations are spatially
variable across the bay, we must consider this rate of Hg deposition for the
- - - - - - - - - - - - - - - - - - - - - - - _ . _ - - - - - -
0
I - -
I
I
--+---1
0
U')
0
U')
~
~
~
~
~
~
!
Fig. 3. Mercury distribution in sediment cores from the northeastern coast of Sepetiba Bay