

214
R.V. Marins et al.
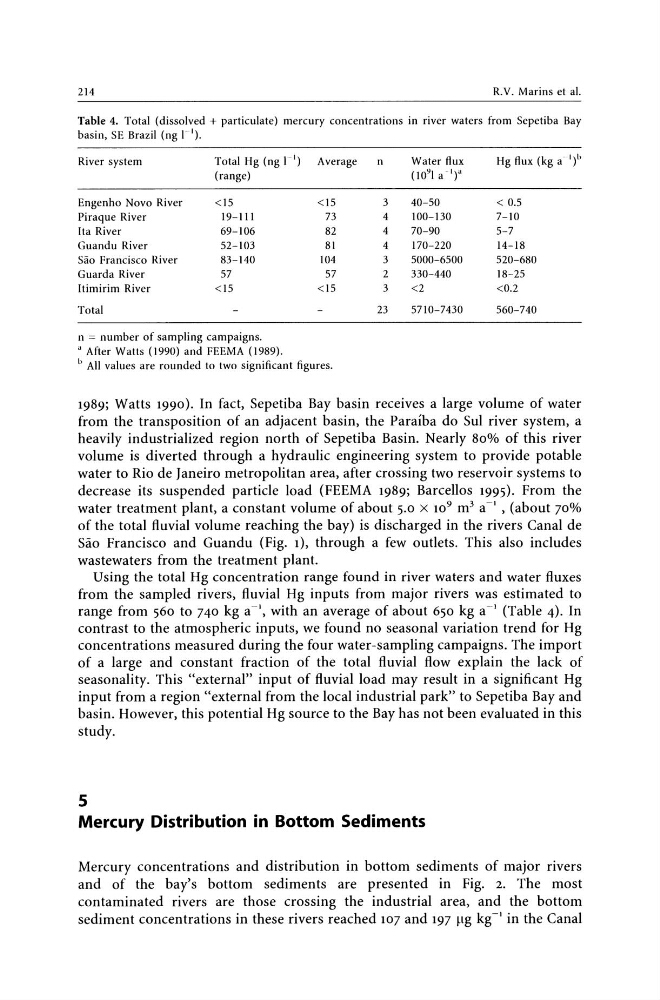
Table 4. Total (dissolved + particulate) mercury concentrations in river waters from Sepetiba Bay
basin, SE Brazil (ng I-I).
River system
Total Hg (ng I-I) Average
n
Water flux
Hg flux (kg a""I)"
(range)
(1091 a-I)a
Engenho Novo River
<15
<15
3
40-50
< 0.5
Piraque River
19-111
73
4
100-130
7-10
Ita River
69-106
82
4
70-90
5-7
Guandu River
52-103
81
4
170-220
14-18
Sao Francisco River
83-140
104
3
5000-6500
520-680
Guarda River
57
57
2
330-440
18-25
Itimirim River
<15
<15
3
<2
<0.2
Total
23
5710-7430
560-740
n = number of sampling campaigns.
a After Watts (1990) and FEEMA (1989).
" All values are rounded to two significant figures.
1989; Watts 1990). In fact, Sepetiba Bay basin receives a large volume of water
from the transposition of an adjacent basin, the Paraiba do SuI river system, a
heavily industrialized region north of Sepetiba Basin. Nearly 80% of this river
volume is diverted through a hydraulic engineering system to provide potable
water to Rio de Janeiro metropolitan area, after crossing two reservoir systems to
decrease its suspended particle load (FEEMA 1989; Barcellos 1995). From the
water treatment plant, a constant volume of about 5.0 x 10 9 m 3 a-I, (about 70%
of the total fluvial volume reaching the bay) is discharged in the rivers Canal de
Sao Francisco and Guandu (Fig. 1), through a few outlets. This also includes
wastewaters from the treatment plant.
Using the total Hg concentration range found in river waters and water fluxes
from the sampled rivers, fluvial Hg inputs from major rivers was estimated to
range from 560 to 740 kg a-I, with an average of about 650 kg a-I (Table 4). In
contrast to the atmospheric inputs, we found no seasonal variation trend for Hg
concentrations measured during the four water-sampling campaigns. The import
of a large and constant fraction of the total fluvial flow explain the lack of
seasonality. This "external" input of fluvial load may result in a significant Hg
input from a region "external from the local industrial park" to Sepetiba Bay and
basin. However, this potential Hg source to the Bay has not been evaluated in this
study.
5
Mercury Distribution in Bottom Sediments
Mercury concentrations and distribution in bottom sediments of major rivers
and of the bay's bottom sediments are presented in Fig. 2. The most
contaminated rivers are those crossing the industrial area, and the bottom
sediment concentrations in these rivers reached 107 and 197 ~Lg kg-I in the Canal
R.V. Marins et al.
Table 4. Total (dissolved + particulate) mercury concentrations in river waters from Sepetiba Bay
basin, SE Brazil (ng I-I).
River system
Total Hg (ng I-I) Average
n
Water flux
Hg flux (kg a""I)"
(range)
(1091 a-I)a
Engenho Novo River
<15
<15
3
40-50
< 0.5
Piraque River
19-111
73
4
100-130
7-10
Ita River
69-106
82
4
70-90
5-7
Guandu River
52-103
81
4
170-220
14-18
Sao Francisco River
83-140
104
3
5000-6500
520-680
Guarda River
57
57
2
330-440
18-25
Itimirim River
<15
<15
3
<2
<0.2
Total
23
5710-7430
560-740
n = number of sampling campaigns.
a After Watts (1990) and FEEMA (1989).
" All values are rounded to two significant figures.
1989; Watts 1990). In fact, Sepetiba Bay basin receives a large volume of water
from the transposition of an adjacent basin, the Paraiba do SuI river system, a
heavily industrialized region north of Sepetiba Basin. Nearly 80% of this river
volume is diverted through a hydraulic engineering system to provide potable
water to Rio de Janeiro metropolitan area, after crossing two reservoir systems to
decrease its suspended particle load (FEEMA 1989; Barcellos 1995). From the
water treatment plant, a constant volume of about 5.0 x 10 9 m 3 a-I, (about 70%
of the total fluvial volume reaching the bay) is discharged in the rivers Canal de
Sao Francisco and Guandu (Fig. 1), through a few outlets. This also includes
wastewaters from the treatment plant.
Using the total Hg concentration range found in river waters and water fluxes
from the sampled rivers, fluvial Hg inputs from major rivers was estimated to
range from 560 to 740 kg a-I, with an average of about 650 kg a-I (Table 4). In
contrast to the atmospheric inputs, we found no seasonal variation trend for Hg
concentrations measured during the four water-sampling campaigns. The import
of a large and constant fraction of the total fluvial flow explain the lack of
seasonality. This "external" input of fluvial load may result in a significant Hg
input from a region "external from the local industrial park" to Sepetiba Bay and
basin. However, this potential Hg source to the Bay has not been evaluated in this
study.
5
Mercury Distribution in Bottom Sediments
Mercury concentrations and distribution in bottom sediments of major rivers
and of the bay's bottom sediments are presented in Fig. 2. The most
contaminated rivers are those crossing the industrial area, and the bottom
sediment concentrations in these rivers reached 107 and 197 ~Lg kg-I in the Canal