

56
F. Dietz
The values for the enrichment factor for different trace elements are summarized in the
following tables. The number of local habitats for the different plants are also given. The
samples were collected once in three to five periods of vegetation and the results are
therefore considered to be representative.
The mean value of the enrichment factor as well as the minimal and maximal value are
given.
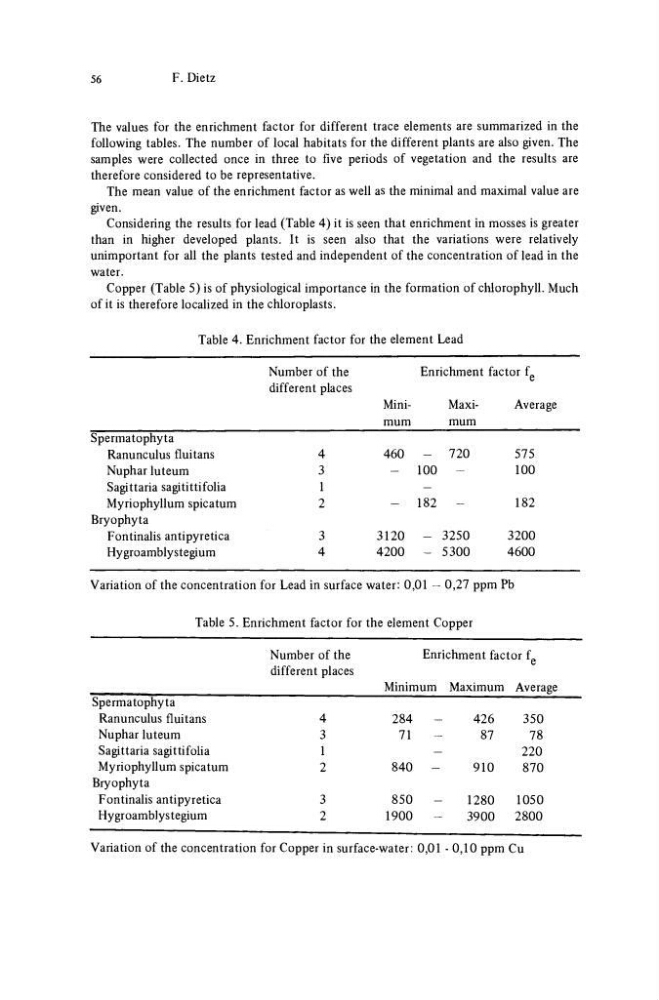
Considering the results for lead (Table 4) it is seen that enrichment in mosses is greater
than in higher developed plants. It is seen also that the variations were relatively
unimportant for all the plants tested and independent of the concentration of lead in the
water.
Copper (Table 5) is of physiological importance in the formation of chlorophyll. Much
of it is therefore localized in the chloroplasts.
Table 4. Enrichment factor for the element Lead
Spermatophyta
Ranunculus fluitans
Nuphar luteum
Sagittaria sagitittifolia
Myriophyllum spicatum
Bryophyta
Fontinalis antipyretica
Hygroamblystegium
Number of the
different places
4
3
1
2
3
4
Minimum
460
-
-
3120
4200
Enrichment factor f p
Maximum
-
720
100
-
-
182
-
- 3250
- 5300
Average
575
100
182
3200
4600
Variation of the concentration for Lead in surface water: 0,01 — 0,27 ppm Pb
Table 5. Enrichment factor for the element Copper
Spermatophyta
Ranunculus fluitans
Nuphar luteum
Sagittaria sagittifolia
Myriophyllum spicatum
Bryophyta
Fontinalis antipyretica
Hy groamb] y stegium
Numbei : of the
different places
4
3
1
2
3
2
Enrichment factor f p
Minimum
284
71
840
850
1900
—
-
-
-
-
—
Maximum
426
87
910
1280
3900
Average
350
78
220
870
1050
2800
Variation of the concentration for Copper in surface-water: 0,01 - 0,10 ppm Cu
F. Dietz
The values for the enrichment factor for different trace elements are summarized in the
following tables. The number of local habitats for the different plants are also given. The
samples were collected once in three to five periods of vegetation and the results are
therefore considered to be representative.
The mean value of the enrichment factor as well as the minimal and maximal value are
given.
Considering the results for lead (Table 4) it is seen that enrichment in mosses is greater
than in higher developed plants. It is seen also that the variations were relatively
unimportant for all the plants tested and independent of the concentration of lead in the
water.
Copper (Table 5) is of physiological importance in the formation of chlorophyll. Much
of it is therefore localized in the chloroplasts.
Table 4. Enrichment factor for the element Lead
Spermatophyta
Ranunculus fluitans
Nuphar luteum
Sagittaria sagitittifolia
Myriophyllum spicatum
Bryophyta
Fontinalis antipyretica
Hygroamblystegium
Number of the
different places
4
3
1
2
3
4
Minimum
460
-
-
3120
4200
Enrichment factor f p
Maximum
-
720
100
-
-
182
-
- 3250
- 5300
Average
575
100
182
3200
4600
Variation of the concentration for Lead in surface water: 0,01 — 0,27 ppm Pb
Table 5. Enrichment factor for the element Copper
Spermatophyta
Ranunculus fluitans
Nuphar luteum
Sagittaria sagittifolia
Myriophyllum spicatum
Bryophyta
Fontinalis antipyretica
Hy groamb] y stegium
Numbei : of the
different places
4
3
1
2
3
2
Enrichment factor f p
Minimum
284
71
840
850
1900
—
-
-
-
-
—
Maximum
426
87
910
1280
3900
Average
350
78
220
870
1050
2800
Variation of the concentration for Copper in surface-water: 0,01 - 0,10 ppm Cu