

The Enrichment of Heavy Metals in Submerged Plants
55
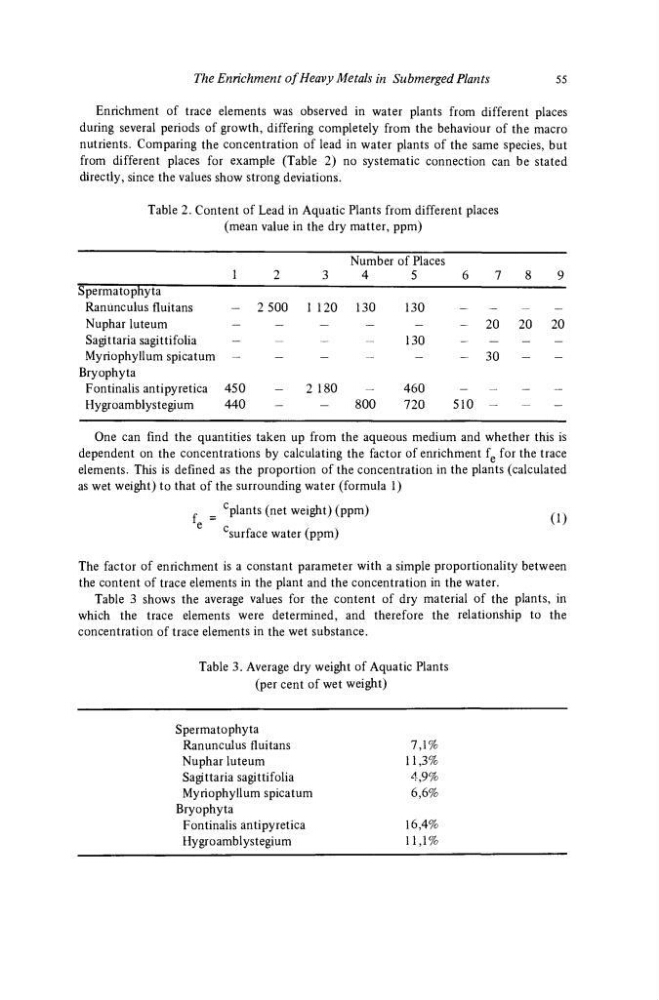
Enrichment of trace elements was observed in water plants from different places
during several periods of growth, differing completely from the behaviour of the macro
nutrients. Comparing the concentration of lead in water plants of the same species, but
from different places for example (Table 2) no systematic connection can be stated
directly, since the values show strong deviations.
Table 2. Content of Lead in Aquatic Plants from different places
(mean value in the dry matter, ppm)
Number of Places
_ _
1 2
3 4
5
6 7 8 9
Spermatophyta ~
~"
—
Ranunculus fluitans
-
2 500 1 120 130
130
-
-
Nupharluteum
-
-
-
-
-
-
20 20 20
Sagittaria sagittifolia
—
—
—
—
130
_ _ _ _
Myriophyllum spicatum -
-
-
-
-
- 3 0 - -
Bryophyta
Fontinalis antipyretica 450
-
2 180
-
460
-
-
-
-
Hygroamblystegium
440
-
-
800
720
510 -
One can find the quantities taken up from the aqueous medium and whether this is
dependent on the concentrations by calculating the factor of enrichment f e for the trace
elements. This is defined as the proportion of the concentration in the plants (calculated
as wet weight) to that of the surrounding water (formula 1)
_
c plants (net weight) (ppm)
, .
Surface water (ppm)
The factor of enrichment is a constant parameter with a simple proportionality between
the content of trace elements in the plant and the concentration in the water.
Table 3 shows the average values for the content of dry material of the plants, in
which the trace elements were determined, and therefore the relationship to the
concentration of trace elements in the wet substance.
Table 3. Average dry weight of Aquatic Plants
(per cent of wet weight)
Spermatophyta
Ranunculus fluitans
7,1%
Nuphar luteum
11,3%
Sagittaria sagittifolia
4,9%
Myriophyllum spicatum
6,6%
Bryophyta
Fontinalis antipyretica
16,4%
Hygroamblystegium
11,1%
55
Enrichment of trace elements was observed in water plants from different places
during several periods of growth, differing completely from the behaviour of the macro
nutrients. Comparing the concentration of lead in water plants of the same species, but
from different places for example (Table 2) no systematic connection can be stated
directly, since the values show strong deviations.
Table 2. Content of Lead in Aquatic Plants from different places
(mean value in the dry matter, ppm)
Number of Places
_ _
1 2
3 4
5
6 7 8 9
Spermatophyta ~
~"
—
Ranunculus fluitans
-
2 500 1 120 130
130
-
-
Nupharluteum
-
-
-
-
-
-
20 20 20
Sagittaria sagittifolia
—
—
—
—
130
_ _ _ _
Myriophyllum spicatum -
-
-
-
-
- 3 0 - -
Bryophyta
Fontinalis antipyretica 450
-
2 180
-
460
-
-
-
-
Hygroamblystegium
440
-
-
800
720
510 -
One can find the quantities taken up from the aqueous medium and whether this is
dependent on the concentrations by calculating the factor of enrichment f e for the trace
elements. This is defined as the proportion of the concentration in the plants (calculated
as wet weight) to that of the surrounding water (formula 1)
_
c plants (net weight) (ppm)
, .
Surface water (ppm)
The factor of enrichment is a constant parameter with a simple proportionality between
the content of trace elements in the plant and the concentration in the water.
Table 3 shows the average values for the content of dry material of the plants, in
which the trace elements were determined, and therefore the relationship to the
concentration of trace elements in the wet substance.
Table 3. Average dry weight of Aquatic Plants
(per cent of wet weight)
Spermatophyta
Ranunculus fluitans
7,1%
Nuphar luteum
11,3%
Sagittaria sagittifolia
4,9%
Myriophyllum spicatum
6,6%
Bryophyta
Fontinalis antipyretica
16,4%
Hygroamblystegium
11,1%