

Redox Potential - A Guide to Oxidation Pond Performance
481
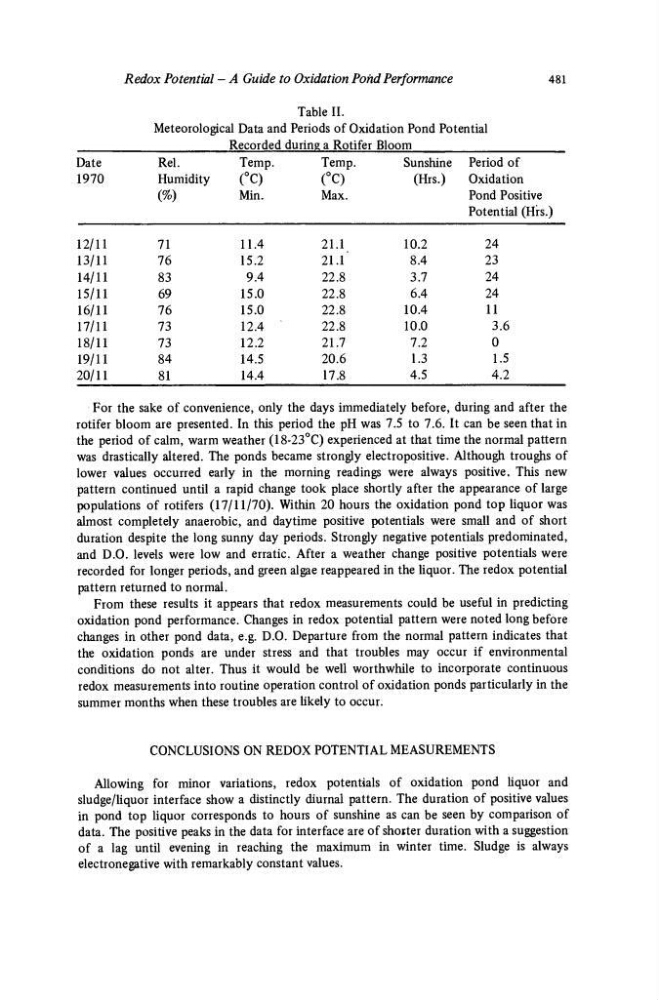
Table II.
Meteorological Data and Periods of Oxidation Pond Potential
Recorded during a Rotifer Bloom
Date
Rel.
Temp.
Temp.
Sunshine Period of
1970
Humidity
(°C)
(°C)
(Hrs.)
Oxidation
(%)
Min.
Max.
Pond Positive
Potential (Hrs.)
12/11
13/11
14/11
15/11
16/11
17/11
18/11
19/11
20/11
71
76
83
69
76
73
73
84
81
11.4
15.2
9.4
15.0
15.0
12.4
12.2
14.5
14.4
21.1
21.1
22.8
22.8
22.8
22.8
21.7
20.6
17.8
10.2
8.4
3.7
6.4
10.4
10.0
7.2
1.3
4.5
24
23
24
24
11
3.6
0
1.5
4.2
For the sake of convenience, only the days immediately before, during and after the
rotifer bloom are presented. In this period the pH was 7.5 to 7.6. It can be seen that in
the period of calm, warm weather (18-23°C) experienced at that time the normal pattern
was drastically altered. The ponds became strongly electropositive. Although troughs of
lower values occurred early in the morning readings were always positive. This new
pattern continued until a rapid change took place shortly after the appearance of large
populations of rotifers (17/11/70). Within 20 hours the oxidation pond top liquor was
almost completely anaerobic, and daytime positive potentials were small and of short
duration despite the long sunny day periods. Strongly negative potentials predominated,
and D.O. levels were low and erratic. After a weather change positive potentials were
recorded for longer periods, and green algae reappeared in the liquor. The redox potential
pattern returned to normal.
From these results it appears that redox measurements could be useful in predicting
oxidation pond performance. Changes in redox potential pattern were noted long before
changes in other pond data, e.g. D.O. Departure from the normal pattern indicates that
the oxidation ponds are under stress and that troubles may occur if environmental
conditions do not alter. Thus it would be well worthwhile to incorporate continuous
redox measurements into routine operation control of oxidation ponds particularly in the
summer months when these troubles are likely to occur.
CONCLUSIONS ON REDOX POTENTIAL MEASUREMENTS
Allowing for minor variations, redox potentials of oxidation pond liquor and
sludge/liquor interface show a distinctly diurnal pattern. The duration of positive values
in pond top liquor corresponds to hours of sunshine as can be seen by comparison of
data. The positive peaks in the data for interface are of shoiter duration with a suggestion
of a lag until evening in reaching the maximum in winter time. Sludge is always
electronegative with remarkably constant values.
481
Table II.
Meteorological Data and Periods of Oxidation Pond Potential
Recorded during a Rotifer Bloom
Date
Rel.
Temp.
Temp.
Sunshine Period of
1970
Humidity
(°C)
(°C)
(Hrs.)
Oxidation
(%)
Min.
Max.
Pond Positive
Potential (Hrs.)
12/11
13/11
14/11
15/11
16/11
17/11
18/11
19/11
20/11
71
76
83
69
76
73
73
84
81
11.4
15.2
9.4
15.0
15.0
12.4
12.2
14.5
14.4
21.1
21.1
22.8
22.8
22.8
22.8
21.7
20.6
17.8
10.2
8.4
3.7
6.4
10.4
10.0
7.2
1.3
4.5
24
23
24
24
11
3.6
0
1.5
4.2
For the sake of convenience, only the days immediately before, during and after the
rotifer bloom are presented. In this period the pH was 7.5 to 7.6. It can be seen that in
the period of calm, warm weather (18-23°C) experienced at that time the normal pattern
was drastically altered. The ponds became strongly electropositive. Although troughs of
lower values occurred early in the morning readings were always positive. This new
pattern continued until a rapid change took place shortly after the appearance of large
populations of rotifers (17/11/70). Within 20 hours the oxidation pond top liquor was
almost completely anaerobic, and daytime positive potentials were small and of short
duration despite the long sunny day periods. Strongly negative potentials predominated,
and D.O. levels were low and erratic. After a weather change positive potentials were
recorded for longer periods, and green algae reappeared in the liquor. The redox potential
pattern returned to normal.
From these results it appears that redox measurements could be useful in predicting
oxidation pond performance. Changes in redox potential pattern were noted long before
changes in other pond data, e.g. D.O. Departure from the normal pattern indicates that
the oxidation ponds are under stress and that troubles may occur if environmental
conditions do not alter. Thus it would be well worthwhile to incorporate continuous
redox measurements into routine operation control of oxidation ponds particularly in the
summer months when these troubles are likely to occur.
CONCLUSIONS ON REDOX POTENTIAL MEASUREMENTS
Allowing for minor variations, redox potentials of oxidation pond liquor and
sludge/liquor interface show a distinctly diurnal pattern. The duration of positive values
in pond top liquor corresponds to hours of sunshine as can be seen by comparison of
data. The positive peaks in the data for interface are of shoiter duration with a suggestion
of a lag until evening in reaching the maximum in winter time. Sludge is always
electronegative with remarkably constant values.