

480
O.D. Brockett and P. Welsby
8.30 a.m., when the oxidation pond liquor became positive. The time taken to do this
appears to be related to light intensity with the readings changing sign more quickly on
bright sunny days than on cloudy days. Neither maximum nor minimum levels of
potential appeared as sharp peaks but rather as plateaux. There was a noticeable overall
symmetry in the graphs for each season, with more subtle variations in daily
measurements appearing to be weather dependent.
Thus it was decided to determine the interdependence between period of oxidation
pond positive potential and meteorological data as recorded at the Manukau Purification
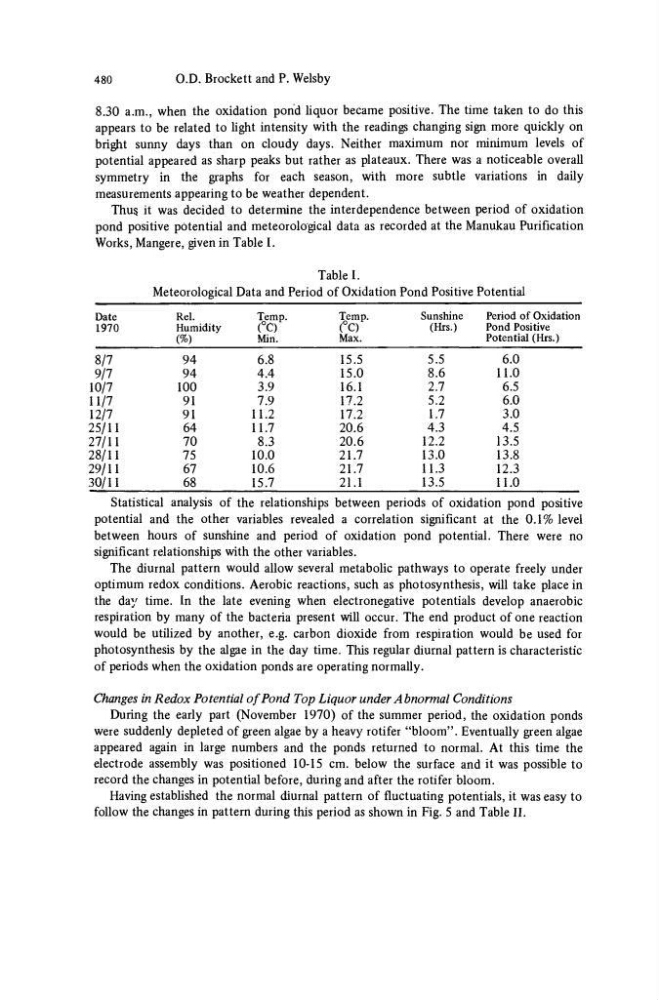
Works, Mangere, given in Table I.
Table I.
Meteorological Data and Period of Oxidation Pond Positive Potential
Date
1970
8/7
9/7
10/7
11/7
12/7
25/11
27/11
28/11
29/11
30/11
Rel.
Humidity
(%)
94
94
100
91
91
64
70
75
67
68
Temp.
(°C)
Min.
6.8
4.4
3.9
7.9
11.2
11.7
8.3
10.0
10.6
15.7
Temp.
(°C)
Max.
15.5
15.0
16.1
17.2
17.2
20.6
20.6
21.7
21.7
21.1
Sunshine
(Hrs.)
5.5
8.6
2.7
5.2
1.7
4.3
12.2
13.0
11.3
13.5
Period of Oxidation
Pond Positive
Potential (Hrs.)
6.0
11.0
6.5
6.0
3.0
4.5
13.5
13.8
12.3
11.0
Statistical analysis of the relationships between periods of oxidation pond positive
potential and the other variables revealed a correlation significant at the 0.1% level
between hours of sunshine and period of oxidation pond potential. There were no
significant relationships with the other variables.
The diurnal pattern would allow several metabolic pathways to operate freely under
optimum redox conditions. Aerobic reactions, such as photosynthesis, will take place in
the day time. In the late evening when electronegative potentials develop anaerobic
respiration by many of the bacteria present will occur. The end product of one reaction
would be utilized by another, e.g. carbon dioxide from respiration would be used for
photosynthesis by the algae in the day time. This regular diurnal pattern is characteristic
of periods when the oxidation ponds are operating normally.
Changes in Redox Potential of Pond Top Liquor under Abnormal Conditions
During the early part (November 1970) of the summer period, the oxidation ponds
were suddenly depleted of green algae by a heavy rotifer "bloom". Eventually green algae
appeared again in large numbers and the ponds returned to normal. At this time the
electrode assembly was positioned 10-15 cm. below the surface and it was possible to
record the changes in potential before, during and after the rotifer bloom.
Having established the normal diurnal pattern of fluctuating potentials, it was easy to
follow the changes in pattern during this period as shown in Fig. 5 and Table II.
O.D. Brockett and P. Welsby
8.30 a.m., when the oxidation pond liquor became positive. The time taken to do this
appears to be related to light intensity with the readings changing sign more quickly on
bright sunny days than on cloudy days. Neither maximum nor minimum levels of
potential appeared as sharp peaks but rather as plateaux. There was a noticeable overall
symmetry in the graphs for each season, with more subtle variations in daily
measurements appearing to be weather dependent.
Thus it was decided to determine the interdependence between period of oxidation
pond positive potential and meteorological data as recorded at the Manukau Purification
Works, Mangere, given in Table I.
Table I.
Meteorological Data and Period of Oxidation Pond Positive Potential
Date
1970
8/7
9/7
10/7
11/7
12/7
25/11
27/11
28/11
29/11
30/11
Rel.
Humidity
(%)
94
94
100
91
91
64
70
75
67
68
Temp.
(°C)
Min.
6.8
4.4
3.9
7.9
11.2
11.7
8.3
10.0
10.6
15.7
Temp.
(°C)
Max.
15.5
15.0
16.1
17.2
17.2
20.6
20.6
21.7
21.7
21.1
Sunshine
(Hrs.)
5.5
8.6
2.7
5.2
1.7
4.3
12.2
13.0
11.3
13.5
Period of Oxidation
Pond Positive
Potential (Hrs.)
6.0
11.0
6.5
6.0
3.0
4.5
13.5
13.8
12.3
11.0
Statistical analysis of the relationships between periods of oxidation pond positive
potential and the other variables revealed a correlation significant at the 0.1% level
between hours of sunshine and period of oxidation pond potential. There were no
significant relationships with the other variables.
The diurnal pattern would allow several metabolic pathways to operate freely under
optimum redox conditions. Aerobic reactions, such as photosynthesis, will take place in
the day time. In the late evening when electronegative potentials develop anaerobic
respiration by many of the bacteria present will occur. The end product of one reaction
would be utilized by another, e.g. carbon dioxide from respiration would be used for
photosynthesis by the algae in the day time. This regular diurnal pattern is characteristic
of periods when the oxidation ponds are operating normally.
Changes in Redox Potential of Pond Top Liquor under Abnormal Conditions
During the early part (November 1970) of the summer period, the oxidation ponds
were suddenly depleted of green algae by a heavy rotifer "bloom". Eventually green algae
appeared again in large numbers and the ponds returned to normal. At this time the
electrode assembly was positioned 10-15 cm. below the surface and it was possible to
record the changes in potential before, during and after the rotifer bloom.
Having established the normal diurnal pattern of fluctuating potentials, it was easy to
follow the changes in pattern during this period as shown in Fig. 5 and Table II.