

Influence of Mechanical Blending on Aerobic Digestion
425
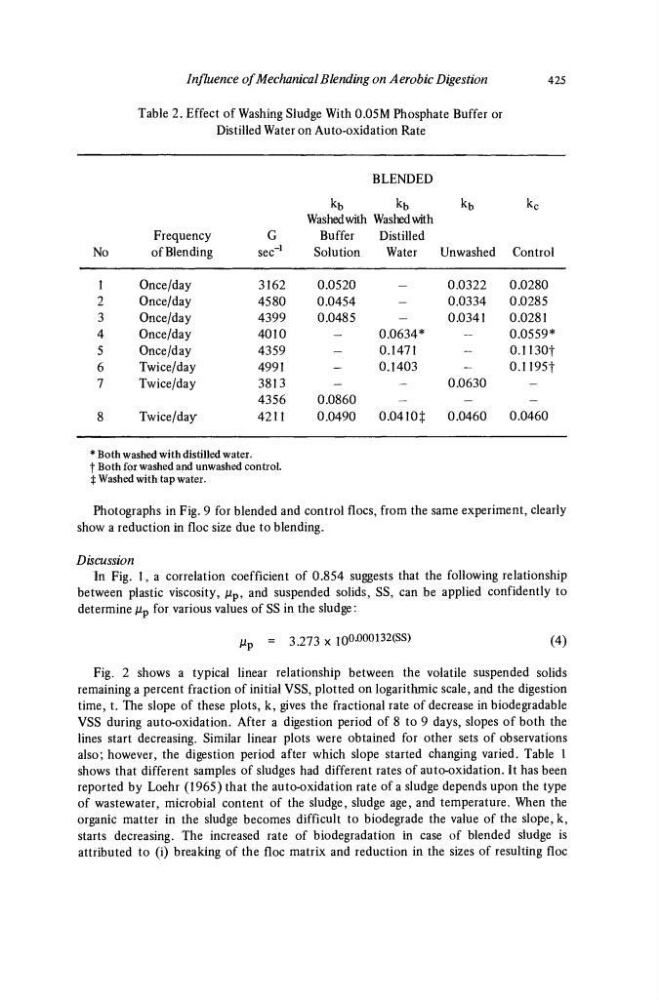
Table 2. Effect of Washing Sludge With 0.05M Phosphate Buffer or
Distilled Water on Auto-oxidation Rate
No
1
2
3
4
5
6
7
8
Frequency
of Blending
Once/day
Once/day
Once/day
Once/day
Once/day
Twice/day
Twice/day
Twice/day
G
sec"
1
3162
4580
4399
4010
4359
4991
3813
4356
4211
kb
BLENDED
k b
Washed with Washed with
Buffer
Solution
0.0520
0.0454
0.0485
—
-
-
-
0.0860
0.0490
Distilled
Water
—
—
0.0634*
0.1471
0.1403
-
—
0.0410$
k b
Unwashed
0.0322
0.0334
0.0341
—
-
-
0.0630
-
0.0460
k c
Control
0.0280
0.0285
0.0281
0.0559*
0.1130t
0.1195t
-
-
0.0460
* Both washed with distilled water.
f Both for washed and unwashed control.
X Washed with tap water.
Photographs in Fig. 9 for blended and control floes, from the same experiment, clearly
show a reduction in floe size due to blending.
Discussion
In Fig. 1, a correlation coefficient of 0.854 suggests that the following relationship
between plastic viscosity, μ ρ , and suspended solids, SS, can be applied confidently to
determine μ ρ for various values of SS in the sludge:
μ Ρ
3.273 x 100.000132(SS)
(4)
Fig. 2 shows a typical linear relationship between the volatile suspended solids
remaining a percent fraction of initial VSS, plotted on logarithmic scale, and the digestion
time, t. The slope of these plots, k, gives the fractional rate of decrease in biodegradable
VSS during auto-oxidation. After a digestion period of 8 to 9 days, slopes of both the
lines start decreasing. Similar linear plots were obtained for other sets of observations
also; however, the digestion period after which slope started changing varied. Table 1
shows that different samples of sludges had different rates of auto-oxidation. It has been
reported by Loehr (1965) that the auto-oxidation rate of a sludge depends upon the type
of wastewater, microbial content of the sludge, sludge age, and temperature. When the
organic matter in the sludge becomes difficult to biodegrade the value of the slope, k,
starts decreasing. The increased rate of biodegradation in case of blended sludge is
attributed to (i) breaking of the floe matrix and reduction in the sizes of resulting floe
425
Table 2. Effect of Washing Sludge With 0.05M Phosphate Buffer or
Distilled Water on Auto-oxidation Rate
No
1
2
3
4
5
6
7
8
Frequency
of Blending
Once/day
Once/day
Once/day
Once/day
Once/day
Twice/day
Twice/day
Twice/day
G
sec"
1
3162
4580
4399
4010
4359
4991
3813
4356
4211
kb
BLENDED
k b
Washed with Washed with
Buffer
Solution
0.0520
0.0454
0.0485
—
-
-
-
0.0860
0.0490
Distilled
Water
—
—
0.0634*
0.1471
0.1403
-
—
0.0410$
k b
Unwashed
0.0322
0.0334
0.0341
—
-
-
0.0630
-
0.0460
k c
Control
0.0280
0.0285
0.0281
0.0559*
0.1130t
0.1195t
-
-
0.0460
* Both washed with distilled water.
f Both for washed and unwashed control.
X Washed with tap water.
Photographs in Fig. 9 for blended and control floes, from the same experiment, clearly
show a reduction in floe size due to blending.
Discussion
In Fig. 1, a correlation coefficient of 0.854 suggests that the following relationship
between plastic viscosity, μ ρ , and suspended solids, SS, can be applied confidently to
determine μ ρ for various values of SS in the sludge:
μ Ρ
3.273 x 100.000132(SS)
(4)
Fig. 2 shows a typical linear relationship between the volatile suspended solids
remaining a percent fraction of initial VSS, plotted on logarithmic scale, and the digestion
time, t. The slope of these plots, k, gives the fractional rate of decrease in biodegradable
VSS during auto-oxidation. After a digestion period of 8 to 9 days, slopes of both the
lines start decreasing. Similar linear plots were obtained for other sets of observations
also; however, the digestion period after which slope started changing varied. Table 1
shows that different samples of sludges had different rates of auto-oxidation. It has been
reported by Loehr (1965) that the auto-oxidation rate of a sludge depends upon the type
of wastewater, microbial content of the sludge, sludge age, and temperature. When the
organic matter in the sludge becomes difficult to biodegrade the value of the slope, k,
starts decreasing. The increased rate of biodegradation in case of blended sludge is
attributed to (i) breaking of the floe matrix and reduction in the sizes of resulting floe