

424
S.D. Bokil and J.K. Bewtra
where S and S 0 are the concentrations of active biomass, measured as VSS, in the system
at digestion times t and t = 0 respectively; k and b are the fractions of VSS digested per
day by endogenous respiration.Therefore the data obtained for biodegradation of VSS have
been plotted on a semilog graph paper. A typical plot of VSS remaining, as percent
fraction of initial VSS, versus time is shown in Fig. 2. The value of G is the average value
for the entire duration of the experiment. Fig. 2 also shows the corresponding effect on
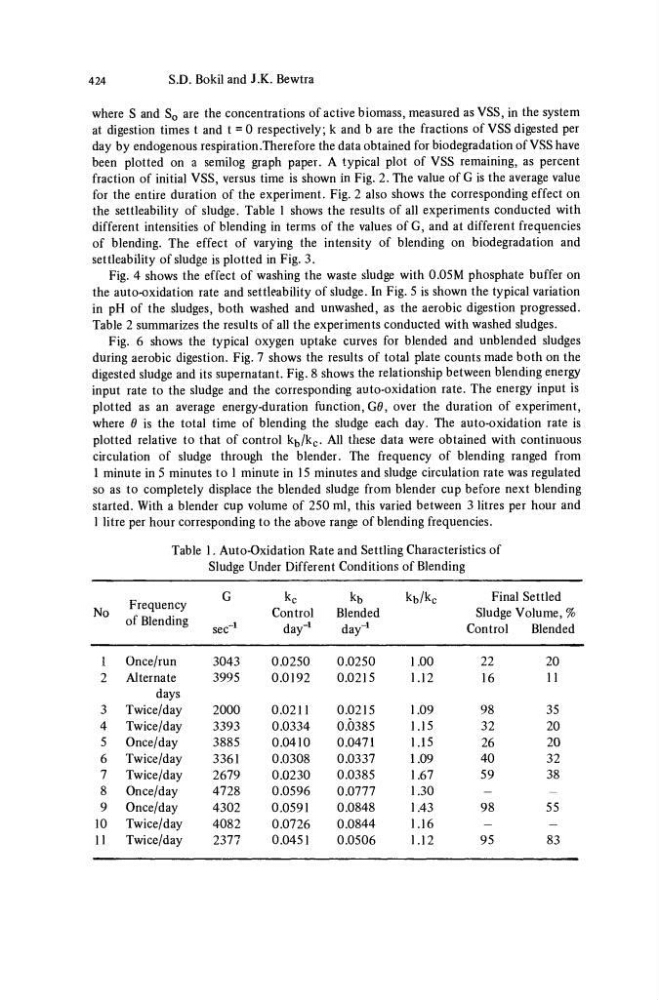
the settleabiHty of sludge. Table 1 shows the results of all experiments conducted with
different intensities of blending in terms of the values of G, and at different frequencies
of blending. The effect of varying the intensity of blending on biodegradation and
settleabiHty of sludge is plotted in Fig. 3.
Fig. 4 shows the effect of washing the waste sludge with 0.05M phosphate buffer on
the auto-oxidation rate and settleabiHty of sludge. In Fig. 5 is shown the typical variation
in pH of the sludges, both washed and unwashed, as the aerobic digestion progressed.
Table 2 summarizes the results of all the experiments conducted with washed sludges.
Fig. 6 shows the typical oxygen uptake curves for blended and unblended sludges
during aerobic digestion. Fig. 7 shows the results of total plate counts made both on the
digested sludge and its supernatant. Fig. 8 shows the relationship between blending energy
input rate to the sludge and the corresponding auto-oxidation rate. The energy input is
plotted as an average energy-duration function, Go, over the duration of experiment,
where Θ is the total time of blending the sludge each day. The auto-oxidation rate is
plotted relative to that of control k b /k c . All these data were obtained with continuous
circulation of sludge through the blender. The frequency of blending ranged from
1 minute in 5 minutes to 1 minute in 15 minutes and sludge circulation rate was regulated
so as to completely displace the blended sludge from blender cup before next blending
started. With a blender cup volume of 250 ml, this varied between 3 litres per hour and
1 litre per hour corresponding to the above range of blending frequencies.
Table 1. Auto-Oxidation Rate and Settling Characteristics of
Sludge Under Different Conditions of Blending
No
1
2
3
4
5
6
7
8
9
10
11
Frequency
of Blending
Once/run
Alternate
days
Twice/day
Twice/day
Once/day
Twice/day
Twice/day
Once/day
Once/day
Twice/day
Twice/day
G
sec"
1
3043
3995
2000
3393
3885
3361
2679
4728
4302
4082
2377
k c
Control
day"
1
0.0250
0.0192
0.0211
0.0334
0.0410
0.0308
0.0230
0.0596
0.0591
0.0726
0.0451
k b
Blended
day"
1
0.0250
0.0215
0.0215
0.0385
0.0471
0.0337
0.0385
0.0777
0.0848
0.0844
0.0506
kb/k c
1.00
1.12
1.09
1.15
1.15
1.09
1.67
1.30
1.43
1.16
1.12
Final Settled
Sludge Volume, %
Control
Blended
22
16
98
32
26
40
59
-
98
—
95
20
11
35
20
20
32
38
-
55
—
83
S.D. Bokil and J.K. Bewtra
where S and S 0 are the concentrations of active biomass, measured as VSS, in the system
at digestion times t and t = 0 respectively; k and b are the fractions of VSS digested per
day by endogenous respiration.Therefore the data obtained for biodegradation of VSS have
been plotted on a semilog graph paper. A typical plot of VSS remaining, as percent
fraction of initial VSS, versus time is shown in Fig. 2. The value of G is the average value
for the entire duration of the experiment. Fig. 2 also shows the corresponding effect on
the settleabiHty of sludge. Table 1 shows the results of all experiments conducted with
different intensities of blending in terms of the values of G, and at different frequencies
of blending. The effect of varying the intensity of blending on biodegradation and
settleabiHty of sludge is plotted in Fig. 3.
Fig. 4 shows the effect of washing the waste sludge with 0.05M phosphate buffer on
the auto-oxidation rate and settleabiHty of sludge. In Fig. 5 is shown the typical variation
in pH of the sludges, both washed and unwashed, as the aerobic digestion progressed.
Table 2 summarizes the results of all the experiments conducted with washed sludges.
Fig. 6 shows the typical oxygen uptake curves for blended and unblended sludges
during aerobic digestion. Fig. 7 shows the results of total plate counts made both on the
digested sludge and its supernatant. Fig. 8 shows the relationship between blending energy
input rate to the sludge and the corresponding auto-oxidation rate. The energy input is
plotted as an average energy-duration function, Go, over the duration of experiment,
where Θ is the total time of blending the sludge each day. The auto-oxidation rate is
plotted relative to that of control k b /k c . All these data were obtained with continuous
circulation of sludge through the blender. The frequency of blending ranged from
1 minute in 5 minutes to 1 minute in 15 minutes and sludge circulation rate was regulated
so as to completely displace the blended sludge from blender cup before next blending
started. With a blender cup volume of 250 ml, this varied between 3 litres per hour and
1 litre per hour corresponding to the above range of blending frequencies.
Table 1. Auto-Oxidation Rate and Settling Characteristics of
Sludge Under Different Conditions of Blending
No
1
2
3
4
5
6
7
8
9
10
11
Frequency
of Blending
Once/run
Alternate
days
Twice/day
Twice/day
Once/day
Twice/day
Twice/day
Once/day
Once/day
Twice/day
Twice/day
G
sec"
1
3043
3995
2000
3393
3885
3361
2679
4728
4302
4082
2377
k c
Control
day"
1
0.0250
0.0192
0.0211
0.0334
0.0410
0.0308
0.0230
0.0596
0.0591
0.0726
0.0451
k b
Blended
day"
1
0.0250
0.0215
0.0215
0.0385
0.0471
0.0337
0.0385
0.0777
0.0848
0.0844
0.0506
kb/k c
1.00
1.12
1.09
1.15
1.15
1.09
1.67
1.30
1.43
1.16
1.12
Final Settled
Sludge Volume, %
Control
Blended
22
16
98
32
26
40
59
-
98
—
95
20
11
35
20
20
32
38
-
55
—
83