

Influence of Temperature and Turbulence on Oxygen Transfer in Water
27
160
c HO
o
o
Q
75 120
£ 100 f80
40+o
Q
20
Δ Pixley Dam
o Baldeney
0
20
40
60
80
100
Jnitial percent of DO saturation
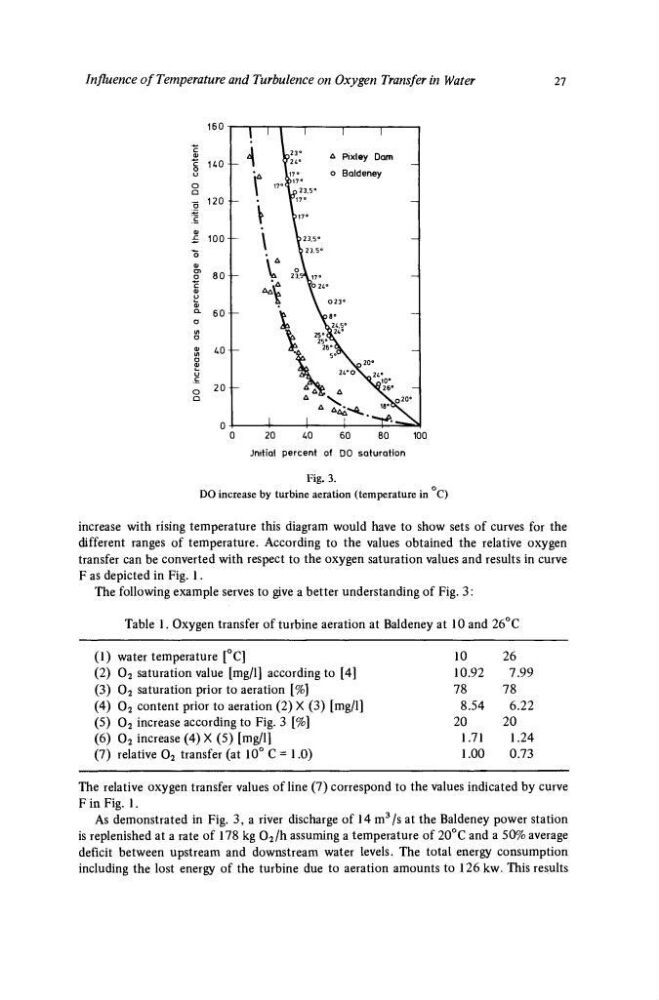
Fig. 3.
DO increase by turbine aeration (temperature in C)
increase with rising temperature this diagram would have to show sets of curves for the
different ranges of temperature. According to the values obtained the relative oxygen
transfer can be converted with respect to the oxygen saturation values and results in curve
F as depicted in Fig. 1.
The following example serves to give a better understanding of Fig. 3:
Table 1. Oxygen transfer of turbine aeration at Baldeney at 10 and 26°C
(1) water temperature [°C]
(2) 0 2 saturation value [mg/1] according to [4]
(3) 0 2 saturation prior to aeration [%]
(4) 0 2 content prior to aeration (2) X (3) [mg/1]
(5) 0 2 increase according to Fig. 3 [%]
(6) 0 2 increase (4) X (5) [mg/1]
(7) relative 0 2 transfer (at 10° C = 1.0)
10
10.92
78
8.54
20
1.71
1.00
26
7.99
78
6.22
20
1.24
0.73
The relative oxygen transfer values of line (7) correspond to the values indicated by curve
F in Fig. 1.
As demonstrated in Fig. 3, a river discharge of 14 m
3 /s at the Baldeney power station
is replenished at a rate of 178 kg 0 2 /h assuming a temperature of 20°C and a 50% average
deficit between upstream and downstream water levels. The total energy consumption
including the lost energy of the turbine due to aeration amounts to 126 kw. This results
27
160
c HO
o
o
Q
75 120
£ 100 f80
40+o
Q
20
Δ Pixley Dam
o Baldeney
0
20
40
60
80
100
Jnitial percent of DO saturation
Fig. 3.
DO increase by turbine aeration (temperature in C)
increase with rising temperature this diagram would have to show sets of curves for the
different ranges of temperature. According to the values obtained the relative oxygen
transfer can be converted with respect to the oxygen saturation values and results in curve
F as depicted in Fig. 1.
The following example serves to give a better understanding of Fig. 3:
Table 1. Oxygen transfer of turbine aeration at Baldeney at 10 and 26°C
(1) water temperature [°C]
(2) 0 2 saturation value [mg/1] according to [4]
(3) 0 2 saturation prior to aeration [%]
(4) 0 2 content prior to aeration (2) X (3) [mg/1]
(5) 0 2 increase according to Fig. 3 [%]
(6) 0 2 increase (4) X (5) [mg/1]
(7) relative 0 2 transfer (at 10° C = 1.0)
10
10.92
78
8.54
20
1.71
1.00
26
7.99
78
6.22
20
1.24
0.73
The relative oxygen transfer values of line (7) correspond to the values indicated by curve
F in Fig. 1.
As demonstrated in Fig. 3, a river discharge of 14 m
3 /s at the Baldeney power station
is replenished at a rate of 178 kg 0 2 /h assuming a temperature of 20°C and a 50% average
deficit between upstream and downstream water levels. The total energy consumption
including the lost energy of the turbine due to aeration amounts to 126 kw. This results