

382
J.L. Barnard. W.W. Eckenfelder, Jr., A.K. Upadhyaya and A.J. Englande
.
/lbs COD APPLIED\
P / M
libs DEC VSS-DAY /
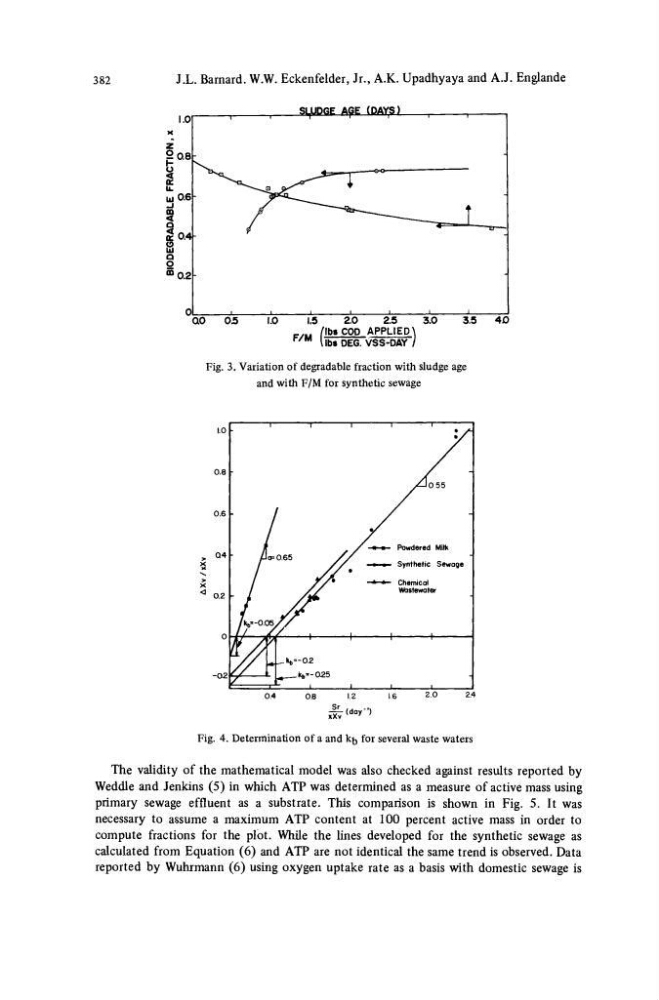
Fig. 3. Variation of degradable fraction with sludge age
and with F/M for synthetic sewage
(day"')
Fig. 4. Determination of a and kfc for several waste waters
The validity of the mathematical model was also checked against results reported by
Weddle and Jenkins (5) in which ATP was determined as a measure of active mass using
primary sewage effluent as a substrate. This comparison is shown in Fig. 5. It was
necessary to assume a maximum ATP content at 100 percent active mass in order to
compute fractions for the plot. While the lines developed for the synthetic sewage as
calculated from Equation (6) and ATP are not identical the same trend is observed. Data
reported by Wuhrmann (6) using oxygen uptake rate as a basis with domestic sewage is
J.L. Barnard. W.W. Eckenfelder, Jr., A.K. Upadhyaya and A.J. Englande
.
/lbs COD APPLIED\
P / M
libs DEC VSS-DAY /
Fig. 3. Variation of degradable fraction with sludge age
and with F/M for synthetic sewage
(day"')
Fig. 4. Determination of a and kfc for several waste waters
The validity of the mathematical model was also checked against results reported by
Weddle and Jenkins (5) in which ATP was determined as a measure of active mass using
primary sewage effluent as a substrate. This comparison is shown in Fig. 5. It was
necessary to assume a maximum ATP content at 100 percent active mass in order to
compute fractions for the plot. While the lines developed for the synthetic sewage as
calculated from Equation (6) and ATP are not identical the same trend is observed. Data
reported by Wuhrmann (6) using oxygen uptake rate as a basis with domestic sewage is