

Design Optimization for Activated Sludge and Extended Aeration Plants
381
After a week of operation, feeding was stopped and the mixed liquor was aerated for
40 days. Suspended solids were determined every fourth day. The results of these
experiments are summarized in Tables 1 and 2.
The biodegradable fraction, x, for each unit was calculated using Equation (6). This
calculated value was compared with the measured values obtained from the batch study
after each continuous run as shown in Tables 1 and 2.
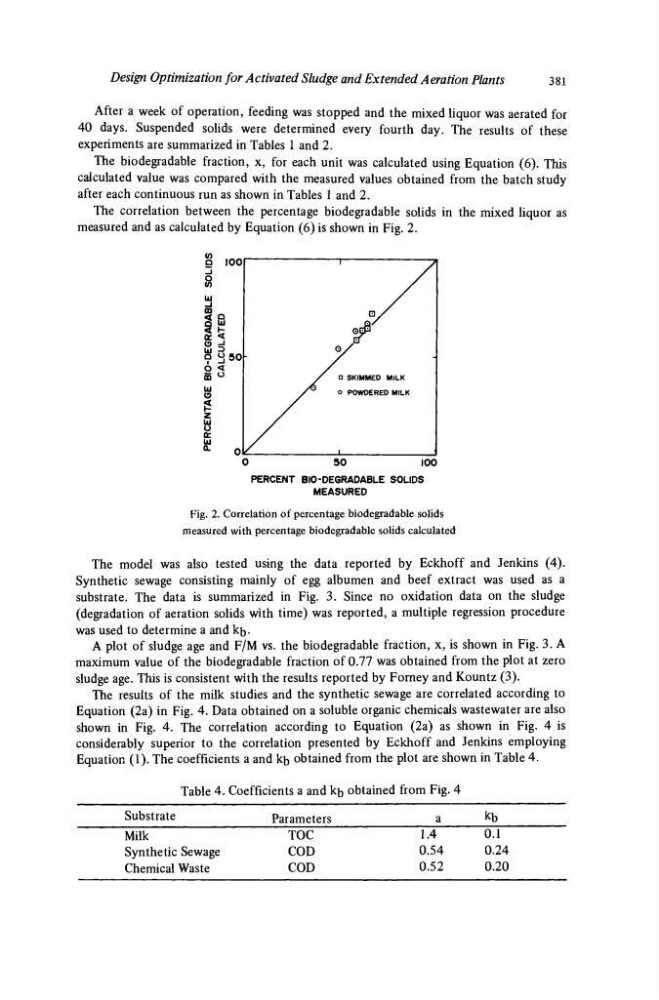
The correlation between the percentage biodegradable solids in the mixed liquor as
measured and as calculated by Equation (6) is shown in Fig. 2.
PERCENT BIO-DEGRADABLE SOLIDS
MEASURED
Fig. 2. Correlation of percentage biodegradable solids
measured with percentage biodegradable solids calculated
The model was also tested using the data reported by Eckhoff and Jenkins (4).
Synthetic sewage consisting mainly of egg albumen and beef extract was used as a
substrate. The data is summarized in Fig. 3. Since no oxidation data on the sludge
(degradation of aeration solids with time) was reported, a multiple regression procedure
was used to determine a and kbA plot of sludge age and F/M vs. the biodegradable fraction, x, is shown in Fig. 3. A
maximum value of the biodegradable fraction of 0.77 was obtained from the plot at zero
sludge age. This is consistent with the results reported by Forney and Kountz (3).
The results of the milk studies and the synthetic sewage are correlated according to
Equation (2a) in Fig. 4. Data obtained on a soluble organic chemicals wastewater are also
shown in Fig. 4. The correlation according to Equation (2a) as shown in Fig. 4 is
considerably superior to the correlation presented by Eckhoff and Jenkins employing
Equation (1). The coefficients a and kb obtained from the plot are shown in Table 4.
Table 4. Coefficients a and kb obtained from Fig. 4
Substrate
Parameters
kb
Milk
Synthetic Sewage
Chemical Waste
TOC
COD
COD
1.4
0.54
0.52
0.1
0.24
0.20
381
After a week of operation, feeding was stopped and the mixed liquor was aerated for
40 days. Suspended solids were determined every fourth day. The results of these
experiments are summarized in Tables 1 and 2.
The biodegradable fraction, x, for each unit was calculated using Equation (6). This
calculated value was compared with the measured values obtained from the batch study
after each continuous run as shown in Tables 1 and 2.
The correlation between the percentage biodegradable solids in the mixed liquor as
measured and as calculated by Equation (6) is shown in Fig. 2.
PERCENT BIO-DEGRADABLE SOLIDS
MEASURED
Fig. 2. Correlation of percentage biodegradable solids
measured with percentage biodegradable solids calculated
The model was also tested using the data reported by Eckhoff and Jenkins (4).
Synthetic sewage consisting mainly of egg albumen and beef extract was used as a
substrate. The data is summarized in Fig. 3. Since no oxidation data on the sludge
(degradation of aeration solids with time) was reported, a multiple regression procedure
was used to determine a and kbA plot of sludge age and F/M vs. the biodegradable fraction, x, is shown in Fig. 3. A
maximum value of the biodegradable fraction of 0.77 was obtained from the plot at zero
sludge age. This is consistent with the results reported by Forney and Kountz (3).
The results of the milk studies and the synthetic sewage are correlated according to
Equation (2a) in Fig. 4. Data obtained on a soluble organic chemicals wastewater are also
shown in Fig. 4. The correlation according to Equation (2a) as shown in Fig. 4 is
considerably superior to the correlation presented by Eckhoff and Jenkins employing
Equation (1). The coefficients a and kb obtained from the plot are shown in Table 4.
Table 4. Coefficients a and kb obtained from Fig. 4
Substrate
Parameters
kb
Milk
Synthetic Sewage
Chemical Waste
TOC
COD
COD
1.4
0.54
0.52
0.1
0.24
0.20