

Contact Stabilization Activated Sludge Process
359
ΙΟΟι
Φ 8 0
i
P
φ 60
c
40l·oContact stabilization
□ Conventional
0.4
0.8
1.2
1.6
Overall net growth rate, μη, day
-
Fig.6. Dependence of Nitrification Ability on Net Growth Rate for Contact
Stabilization and Conventional Activated Sludge
100
80
5
6 0
Ό
> 4θ£
* X
r/**
-Ö-^Fo Contact
• Stabilization
A Data of Weddle and
Jenkins (1970 {
4
8
12
16
20
Contact removal rate, q c , day"
1
24
Fig.7. Viability of Contact Stabilization and Conventional Activated Sludge
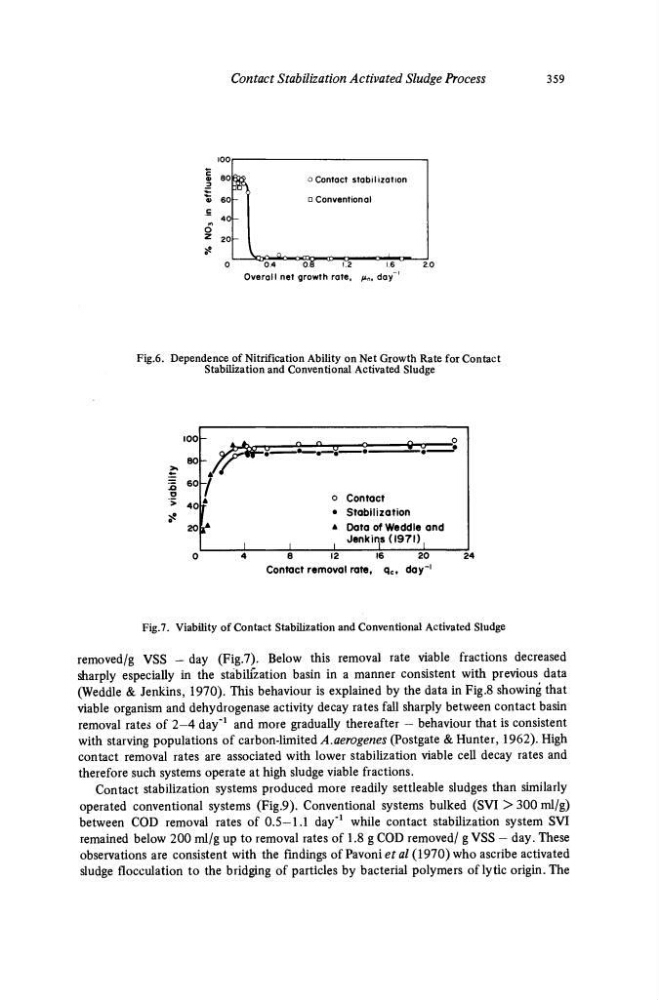
removed/g VSS - day (Fig.7). Below this removal rate viable fractions decreased
sharply especially in the stabilization basin in a manner consistent with previous data
(Weddle & Jenkins, 1970). This behaviour is explained by the data in Fig.8 showing that
viable organism and dehydrogenase activity decay rates fall sharply between contact basin
removal rates of 2-4 day"
1 and more gradually thereafter - behaviour that is consistent
with starving populations of carbon-limited A.aerogenes (Postgate & Hunter, 1962). High
contact removal rates are associated with lower stabilization viable cell decay rates and
therefore such systems operate at high sludge viable fractions.
Contact stabilization systems produced more readily settleable sludges than similarly
operated conventional systems (Fig.9). Conventional systems bulked (SVI > 300 ml/g)
between COD removal rates of 0.5—1.1 day"
1 while contact stabilization system SVI
remained below 200 ml/g up to removal rates of 1.8 g COD removed/ g VSS - day. These
observations are consistent with the findings of Pavoni et al (1970) who ascribe activated
sludge flocculation to the bridging of particles by bacterial polymers of lytic origin. The
359
ΙΟΟι
Φ 8 0
i
P
φ 60
c
40l·oContact stabilization
□ Conventional
0.4
0.8
1.2
1.6
Overall net growth rate, μη, day
-
Fig.6. Dependence of Nitrification Ability on Net Growth Rate for Contact
Stabilization and Conventional Activated Sludge
100
80
5
6 0
Ό
> 4θ£
* X
r/**
-Ö-^Fo Contact
• Stabilization
A Data of Weddle and
Jenkins (1970 {
4
8
12
16
20
Contact removal rate, q c , day"
1
24
Fig.7. Viability of Contact Stabilization and Conventional Activated Sludge
removed/g VSS - day (Fig.7). Below this removal rate viable fractions decreased
sharply especially in the stabilization basin in a manner consistent with previous data
(Weddle & Jenkins, 1970). This behaviour is explained by the data in Fig.8 showing that
viable organism and dehydrogenase activity decay rates fall sharply between contact basin
removal rates of 2-4 day"
1 and more gradually thereafter - behaviour that is consistent
with starving populations of carbon-limited A.aerogenes (Postgate & Hunter, 1962). High
contact removal rates are associated with lower stabilization viable cell decay rates and
therefore such systems operate at high sludge viable fractions.
Contact stabilization systems produced more readily settleable sludges than similarly
operated conventional systems (Fig.9). Conventional systems bulked (SVI > 300 ml/g)
between COD removal rates of 0.5—1.1 day"
1 while contact stabilization system SVI
remained below 200 ml/g up to removal rates of 1.8 g COD removed/ g VSS - day. These
observations are consistent with the findings of Pavoni et al (1970) who ascribe activated
sludge flocculation to the bridging of particles by bacterial polymers of lytic origin. The