

358
D. Jenkins and D. Orhon
O
08
1. 6
24
Overall removal rate, q, day
- '
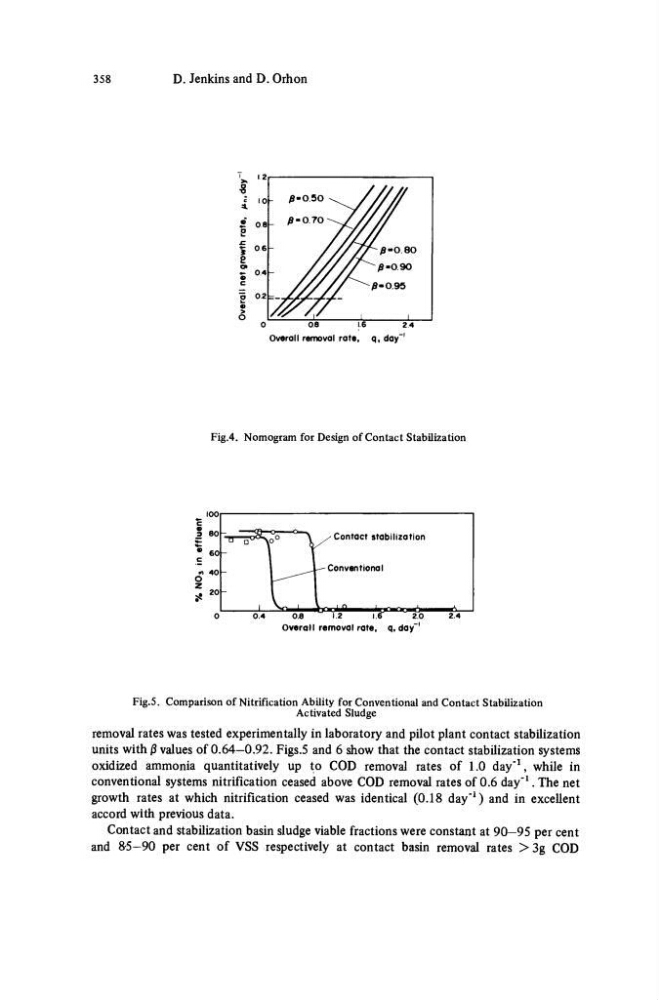
Fig.4. Nomogram for Design of Contact Stabilization
0.4
0.8
1.2
1.6
2.0
Overall removal rate, q, day"'
Fig.5. Comparison of Nitrification Ability for Conventional and Contact Stabilization
Activated Sludge
removal rates was tested experimentally in laboratory and pilot plant contact stabilization
units with ß values of 0.64-0.92. Figs.5 and 6 show that the contact stabilization systems
oxidized ammonia quantitatively up to COD removal rates of 1.0 day"
1
, while in
conventional systems nitrification ceased above COD removal rates of 0.6 day"
1
. The net
growth rates at which nitrification ceased was identical (0.18 day"
1
) and in excellent
accord with previous data.
Contact and stabilization basin sludge viable fractions were constant at 90—95 per cent
and 8-5-90 per cent of VSS respectively at contact basin removal rates > 3g COD
D. Jenkins and D. Orhon
O
08
1. 6
24
Overall removal rate, q, day
- '
Fig.4. Nomogram for Design of Contact Stabilization
0.4
0.8
1.2
1.6
2.0
Overall removal rate, q, day"'
Fig.5. Comparison of Nitrification Ability for Conventional and Contact Stabilization
Activated Sludge
removal rates was tested experimentally in laboratory and pilot plant contact stabilization
units with ß values of 0.64-0.92. Figs.5 and 6 show that the contact stabilization systems
oxidized ammonia quantitatively up to COD removal rates of 1.0 day"
1
, while in
conventional systems nitrification ceased above COD removal rates of 0.6 day"
1
. The net
growth rates at which nitrification ceased was identical (0.18 day"
1
) and in excellent
accord with previous data.
Contact and stabilization basin sludge viable fractions were constant at 90—95 per cent
and 8-5-90 per cent of VSS respectively at contact basin removal rates > 3g COD