

346
T.E. Pollock and J.D. Norman
1000
^ 9 0 0
z 800
700
6 0 0
1
C B- 6 4 0 4 +2l6.4t
(^»633.3+288.41 - 8 0 86t' H
CB- 632.0 + 299.3t - 9 1 2 4 Γ
0.5
_L
,*#*»
T
1
T
MODEL
o
•
Δ
D
DOMAIN (t) hrs
0 to 1.0
0 to 1.25
0 to 1. 5
0 to 1.75
_L
IO
TIME (t) hrs.
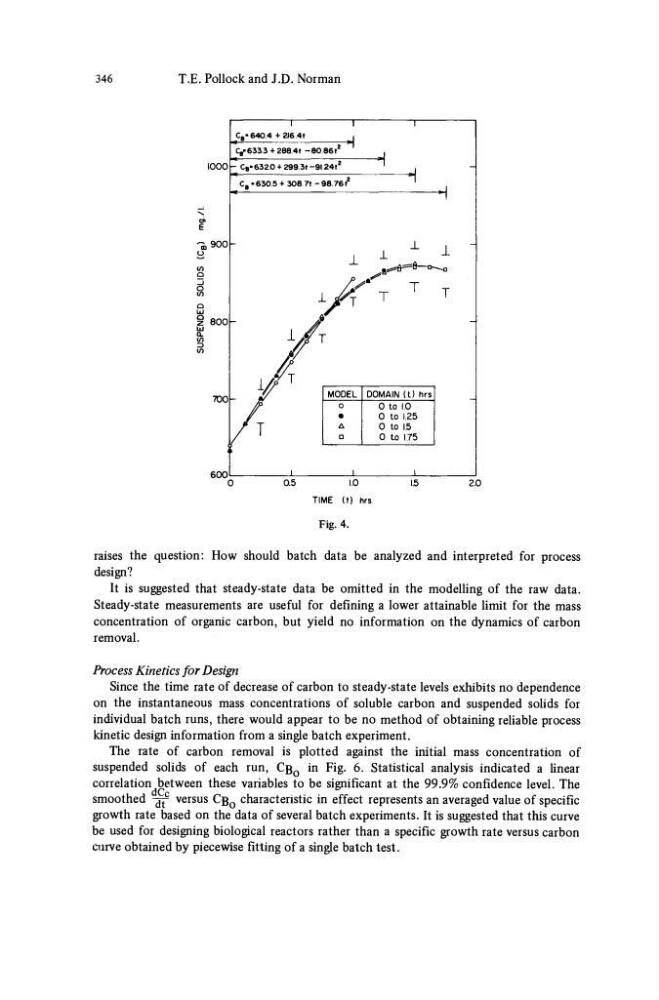
Fig. 4.
1. 5
2.0
raises the question: How should batch data be analyzed and interpreted for process
design?
It is suggested that steady-state data be omitted in the modelling of the raw data.
Steady-state measurements are useful for defining a lower attainable limit for the mass
concentration of organic carbon, but yield no information on the dynamics of carbon
removal.
Process Kinetics for Design
Since the time rate of decrease of carbon to steady-state levels exhibits no dependence
on the instantaneous mass concentrations of soluble carbon and suspended solids for
individual batch runs, there would appear to be no method of obtaining reliable process
kinetic design information from a single batch experiment.
The rate of carbon removal is plotted against the initial mass concentration of
suspended solids of each run, Cß 0 in Fig. 6. Statistical analysis indicated a linear
correlation between these variables to be significant at the 99.9% confidence level. The
smoothed -^ versus Cß 0 characteristic in effect represents an averaged value of specific
growth rate based on the data of several batch experiments. It is suggested that this curve
be used for designing biological reactors rather than a specific growth rate versus carbon
curve obtained by piece wise fitting of a single batch test.
T.E. Pollock and J.D. Norman
1000
^ 9 0 0
z 800
700
6 0 0
1
C B- 6 4 0 4 +2l6.4t
(^»633.3+288.41 - 8 0 86t' H
CB- 632.0 + 299.3t - 9 1 2 4 Γ
0.5
_L
,*#*»
T
1
T
MODEL
o
•
Δ
D
DOMAIN (t) hrs
0 to 1.0
0 to 1.25
0 to 1. 5
0 to 1.75
_L
IO
TIME (t) hrs.
Fig. 4.
1. 5
2.0
raises the question: How should batch data be analyzed and interpreted for process
design?
It is suggested that steady-state data be omitted in the modelling of the raw data.
Steady-state measurements are useful for defining a lower attainable limit for the mass
concentration of organic carbon, but yield no information on the dynamics of carbon
removal.
Process Kinetics for Design
Since the time rate of decrease of carbon to steady-state levels exhibits no dependence
on the instantaneous mass concentrations of soluble carbon and suspended solids for
individual batch runs, there would appear to be no method of obtaining reliable process
kinetic design information from a single batch experiment.
The rate of carbon removal is plotted against the initial mass concentration of
suspended solids of each run, Cß 0 in Fig. 6. Statistical analysis indicated a linear
correlation between these variables to be significant at the 99.9% confidence level. The
smoothed -^ versus Cß 0 characteristic in effect represents an averaged value of specific
growth rate based on the data of several batch experiments. It is suggested that this curve
be used for designing biological reactors rather than a specific growth rate versus carbon
curve obtained by piece wise fitting of a single batch test.