

Uncertainty in Interpreting Biological Growth Rates
345
predicts specific growth rates which are significantly greater than those predicted through
the use of single domain regression. For an effluent carbon requirement of 20 mg/1, the
batch experiments of this investigation result in specific growth rate estimates of from 2
to 4 times greater when the same raw data is regressed in a two domain rather than a
single domain fashion.
Since the magnitude of specific growth rate is inversely proportional to reactor
residence time and thus inversely proportional to cost, it is evident that the modelling
procedures used for the raw data exert a significant influence on the capital and operating
economics of an aeration tank.
The large differences in the prediction of specific growth rate for the two types of raw
data modelling arise from the fact that the single domain regression models contain a
number of steady-state data entries while, as precursors of specific growth rate prediction,
the piece wise models do not.
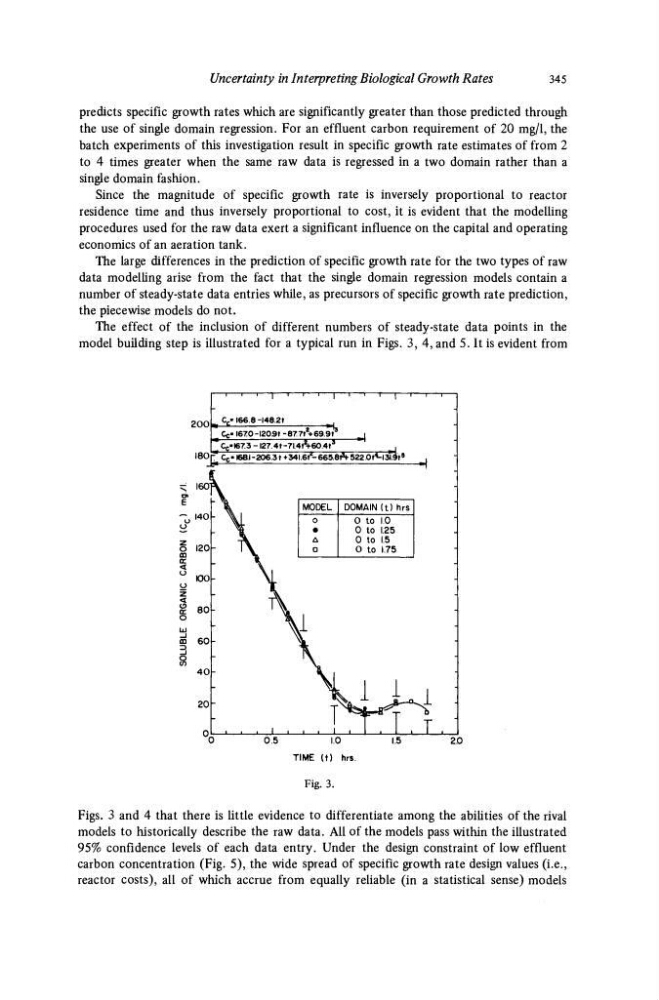
The effect of the inclusion of different numbers of steady-state data points in the
model building step is illustrated for a typical run in Figs. 3, 4, and 5. It is evident from
200
180
< 160'
E
~„ 140
o
o 120
m
UBLE ORGANIC CAR
o o
o
_l
40
20
n
-
- Γ"
V
Cc"
V
Cc'
_ L_
—i
166.8
1670
6B.IT !
-148.21
-I20.9t
-I27.4t
-|
1
r
1
- 87 7t
2
+69.9t
3
-7l.4t
z
+60.4t
S
I
1
1
|
.
»|
206.31 ♦ 341.61*-665.8Λ- 522jOt^-läät
8
. 1
^
MODEL
o
•
Δ
a
1
1
. 1 . . 1.
T
1
DOMAIN (t) hrs
0 to 1.0
0 to 1.25
0 to 1. 5
0 to 1.75
— i — i — i
«J
1
J
■J
-
4 ■
T. '
0.5
1.0
TIME (t) hrs.
2.0
Fig. 3.
Figs. 3 and 4 that there is little evidence to differentiate among the abilities of the rival
models to historically describe the raw data. All of the models pass within the illustrated
95% confidence levels of each data entry. Under the design constraint of low effluent
carbon concentration (Fig. 5), the wide spread of specific growth rate design values (i.e.,
reactor costs), all of which accrue from equally reliable (in a statistical sense) models
345
predicts specific growth rates which are significantly greater than those predicted through
the use of single domain regression. For an effluent carbon requirement of 20 mg/1, the
batch experiments of this investigation result in specific growth rate estimates of from 2
to 4 times greater when the same raw data is regressed in a two domain rather than a
single domain fashion.
Since the magnitude of specific growth rate is inversely proportional to reactor
residence time and thus inversely proportional to cost, it is evident that the modelling
procedures used for the raw data exert a significant influence on the capital and operating
economics of an aeration tank.
The large differences in the prediction of specific growth rate for the two types of raw
data modelling arise from the fact that the single domain regression models contain a
number of steady-state data entries while, as precursors of specific growth rate prediction,
the piece wise models do not.
The effect of the inclusion of different numbers of steady-state data points in the
model building step is illustrated for a typical run in Figs. 3, 4, and 5. It is evident from
200
180
< 160'
E
~„ 140
o
o 120
m
UBLE ORGANIC CAR
o o
o
_l
40
20
n
-
- Γ"
V
Cc"
V
Cc'
_ L_
—i
166.8
1670
6B.IT !
-148.21
-I20.9t
-I27.4t
-|
1
r
1
- 87 7t
2
+69.9t
3
-7l.4t
z
+60.4t
S
I
1
1
|
.
»|
206.31 ♦ 341.61*-665.8Λ- 522jOt^-läät
8
. 1
^
MODEL
o
•
Δ
a
1
1
. 1 . . 1.
T
1
DOMAIN (t) hrs
0 to 1.0
0 to 1.25
0 to 1. 5
0 to 1.75
— i — i — i
«J
1
J
■J
-
4 ■
T. '
0.5
1.0
TIME (t) hrs.
2.0
Fig. 3.
Figs. 3 and 4 that there is little evidence to differentiate among the abilities of the rival
models to historically describe the raw data. All of the models pass within the illustrated
95% confidence levels of each data entry. Under the design constraint of low effluent
carbon concentration (Fig. 5), the wide spread of specific growth rate design values (i.e.,
reactor costs), all of which accrue from equally reliable (in a statistical sense) models