

Predictions of Temperature in Streams R eceiving Thermal Discharges
17
5
10
15
20
25
30
# C
WATER TEMPERATURE AT AARE CONFLUENCE
TWA
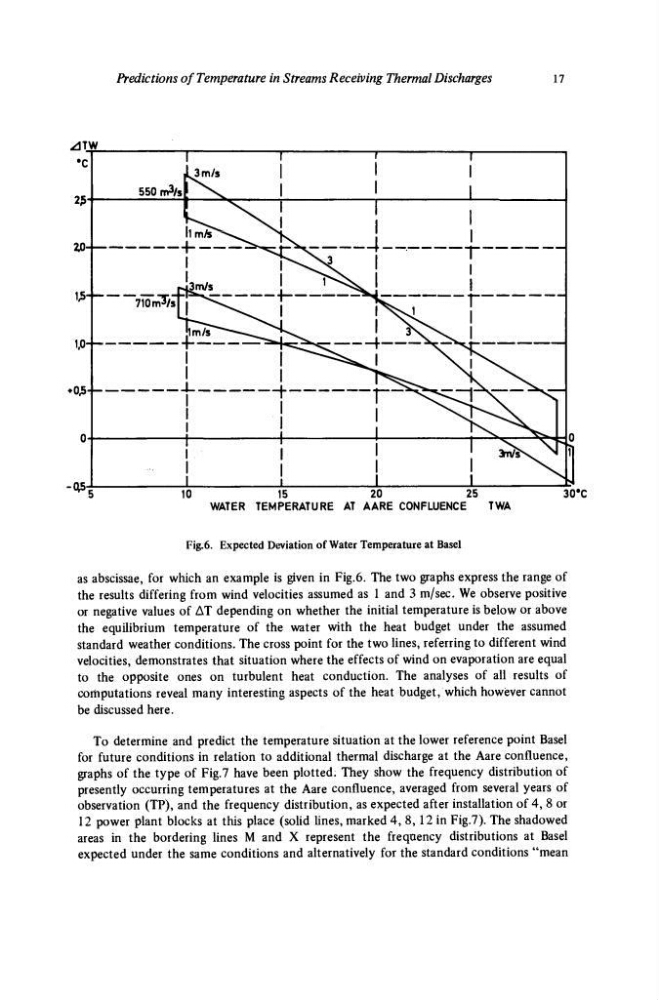
Fig.6. Expected Deviation of Water Temperature at Basel
as abscissae, for which an example is given in Fig.6. The two graphs express the range of
the results differing from wind velocities assumed as 1 and 3 m/sec. We observe positive
or negative values of ΔΤ depending on whether the initial temperature is below or above
the equilibrium temperature of the water with the heat budget under the assumed
standard weather conditions. The cross point for the two lines, referring to different wind
velocities, demonstrates that situation where the effects of wind on evaporation are equal
to the opposite ones on turbulent heat conduction. The analyses of all results of
computations reveal many interesting aspects of the heat budget, which however cannot
be discussed here.
To determine and predict the temperature situation at the lower reference point Basel
for future conditions in relation to additional thermal discharge at the Aare confluence,
graphs of the type of Fig.7 have been plotted. They show the frequency distribution of
presently occurring temperatures at the Aare confluence, averaged from several years of
observation (TP), and the frequency distribution, as expected after installation of 4, 8 or
12 power plant blocks at this place (solid lines, marked 4, 8, 12 in Fig.7). The shadowed
areas in the bordering lines M and X represent the frequency distributions at Basel
expected under the same conditions and alternatively for the standard conditions "mean
17
5
10
15
20
25
30
# C
WATER TEMPERATURE AT AARE CONFLUENCE
TWA
Fig.6. Expected Deviation of Water Temperature at Basel
as abscissae, for which an example is given in Fig.6. The two graphs express the range of
the results differing from wind velocities assumed as 1 and 3 m/sec. We observe positive
or negative values of ΔΤ depending on whether the initial temperature is below or above
the equilibrium temperature of the water with the heat budget under the assumed
standard weather conditions. The cross point for the two lines, referring to different wind
velocities, demonstrates that situation where the effects of wind on evaporation are equal
to the opposite ones on turbulent heat conduction. The analyses of all results of
computations reveal many interesting aspects of the heat budget, which however cannot
be discussed here.
To determine and predict the temperature situation at the lower reference point Basel
for future conditions in relation to additional thermal discharge at the Aare confluence,
graphs of the type of Fig.7 have been plotted. They show the frequency distribution of
presently occurring temperatures at the Aare confluence, averaged from several years of
observation (TP), and the frequency distribution, as expected after installation of 4, 8 or
12 power plant blocks at this place (solid lines, marked 4, 8, 12 in Fig.7). The shadowed
areas in the bordering lines M and X represent the frequency distributions at Basel
expected under the same conditions and alternatively for the standard conditions "mean