

16
F. Berger and W. Schmitz
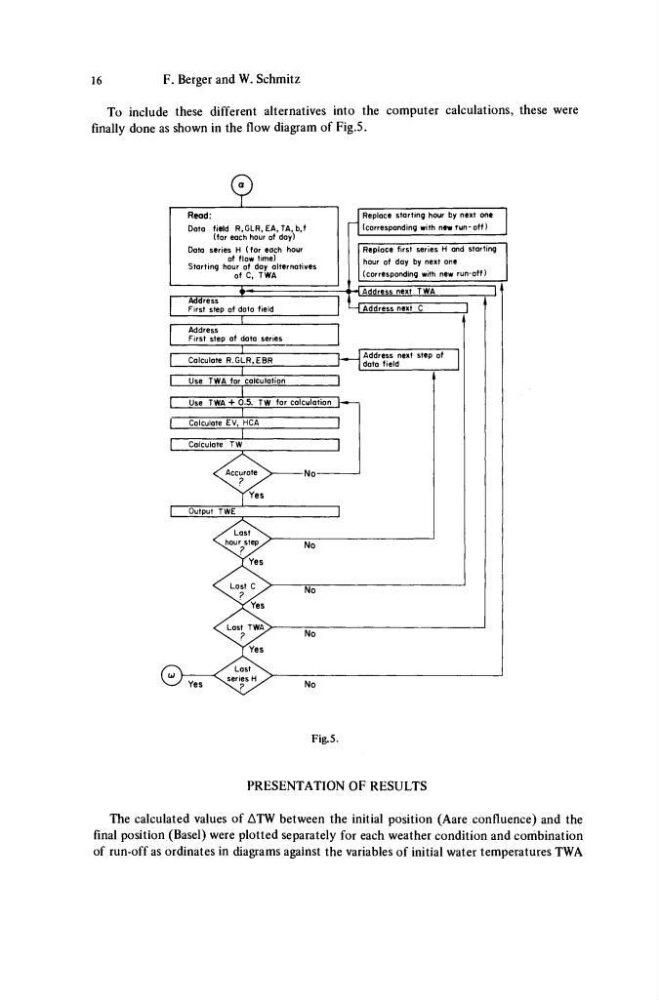
To include these different alternatives into the computer calculations, these were
finally done as shown in the flow diagram of Fig.5.
£
Read:
Data field R.GLR, EA.TA, b,f
(for each hour of day)
Data series H (for each hour
of flow time)
Starting hour of day alternatives
of C, TWA
Address
First step of data field
Replace starting hour by next one
(corresponding with new run-off)
Replace first series H and starting
hour of day by next one
(corresponding with new run-off)
Address next TWA
I Address next C
Address next step of
data field
No
No
No
No
Fig.5.
PRESENTATION OF RESULTS
The calculated values of ATW between the initial position (Aare confluence) and the
final position (Basel) were plotted separately for each weather condition and combination
of run-off as ordinates in diagrams against the variables of initial water temperatures TWA
F. Berger and W. Schmitz
To include these different alternatives into the computer calculations, these were
finally done as shown in the flow diagram of Fig.5.
£
Read:
Data field R.GLR, EA.TA, b,f
(for each hour of day)
Data series H (for each hour
of flow time)
Starting hour of day alternatives
of C, TWA
Address
First step of data field
Replace starting hour by next one
(corresponding with new run-off)
Replace first series H and starting
hour of day by next one
(corresponding with new run-off)
Address next TWA
I Address next C
Address next step of
data field
No
No
No
No
Fig.5.
PRESENTATION OF RESULTS
The calculated values of ATW between the initial position (Aare confluence) and the
final position (Basel) were plotted separately for each weather condition and combination
of run-off as ordinates in diagrams against the variables of initial water temperatures TWA