

Predictions of Temperature in Streams R eceiving Thermal Discharges
15
mmHg
15
10
5
0
0
6
12
18
U
HOUR
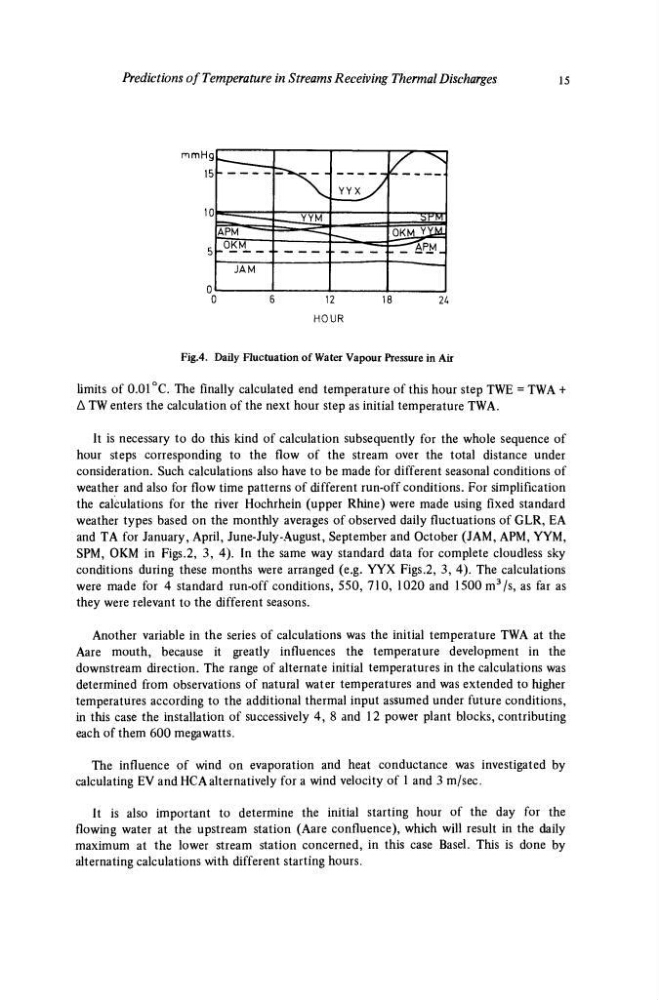
Fig.4. Daily Fluctuation of Water Vapour Pressure in Air
limits of 0.01 °C. The finally calculated end temperature of this hour step TWE = TWA +
Δ TW enters the calculation of the next hour step as initial temperature TWA.
It is necessary to do this kind of calculation subsequently for the whole sequence of
hour steps corresponding to the flow of the stream over the total distance under
consideration. Such calculations also have to be made for different seasonal conditions of
weather and also for flow time patterns of different run-off conditions. For simplification
the calculations for the river Hochrhein (upper Rhine) were made using fixed standard
weather types based on the monthly averages of observed daily fluctuations of GLR, EA
and TA for January, April, June-July-August, September and October (JAM, APM, YYM,
SPM, OKM in Figs.2, 3, 4). In the same way standard data for complete cloudless sky
conditions during these months were arranged (e.g. YYX Figs.2, 3, 4). The calculations
were made for 4 standard run-off conditions, 550, 710, 1020 and 1500 m
3 /s, as far as
they were relevant to the different seasons.
Another variable in the series of calculations was the initial temperature TWA at the
Aare mouth, because it greatly influences the temperature development in the
downstream direction. The range of alternate initial temperatures in the calculations was
determined from observations of natural water temperatures and was extended to higher
temperatures according to the additional thermal input assumed under future conditions,
in this case the installation of successively 4, 8 and 12 power plant blocks, contributing
each of them 600 megawatts.
The influence of wind on evaporation and heat conductance was investigated by
calculating EV and HC A alternatively for a wind velocity of 1 and 3 m/sec.
It is also important to determine the initial starting hour of the day for the
flowing water at the upstream station (Aare confluence), which will result in the daily
maximum at the lower stream station concerned, in this case Basel. This is done by
alternating calculations with different starting hours.
15
mmHg
15
10
5
0
0
6
12
18
U
HOUR
Fig.4. Daily Fluctuation of Water Vapour Pressure in Air
limits of 0.01 °C. The finally calculated end temperature of this hour step TWE = TWA +
Δ TW enters the calculation of the next hour step as initial temperature TWA.
It is necessary to do this kind of calculation subsequently for the whole sequence of
hour steps corresponding to the flow of the stream over the total distance under
consideration. Such calculations also have to be made for different seasonal conditions of
weather and also for flow time patterns of different run-off conditions. For simplification
the calculations for the river Hochrhein (upper Rhine) were made using fixed standard
weather types based on the monthly averages of observed daily fluctuations of GLR, EA
and TA for January, April, June-July-August, September and October (JAM, APM, YYM,
SPM, OKM in Figs.2, 3, 4). In the same way standard data for complete cloudless sky
conditions during these months were arranged (e.g. YYX Figs.2, 3, 4). The calculations
were made for 4 standard run-off conditions, 550, 710, 1020 and 1500 m
3 /s, as far as
they were relevant to the different seasons.
Another variable in the series of calculations was the initial temperature TWA at the
Aare mouth, because it greatly influences the temperature development in the
downstream direction. The range of alternate initial temperatures in the calculations was
determined from observations of natural water temperatures and was extended to higher
temperatures according to the additional thermal input assumed under future conditions,
in this case the installation of successively 4, 8 and 12 power plant blocks, contributing
each of them 600 megawatts.
The influence of wind on evaporation and heat conductance was investigated by
calculating EV and HC A alternatively for a wind velocity of 1 and 3 m/sec.
It is also important to determine the initial starting hour of the day for the
flowing water at the upstream station (Aare confluence), which will result in the daily
maximum at the lower stream station concerned, in this case Basel. This is done by
alternating calculations with different starting hours.