

294
R.D. Pomeroy and J.D. Parkhurst
Results from various test sites are given in Fig. 4. The designations of the sampling
sites, shown at the bottom, consist of numbers followed by letters. The numbers signify
the sewer pipe diameters in inches. There is a tendency for R r to be lower in small sewers
than in large ones. It was found that R r usually increases as the sewage flows along.
The sewage from test site 24C has an abnormally low value. It was found that the pH
of that sewage was quite high much of the time, up to 10.0, thus suppressing biological
activity. The high pH is due to the frequent discharging of highly alkaline industrial
wastes, a practice encouraged by the Sanitation Districts because of the beneficial effect
in suppressing sulfide generation.
Two series of tests, one in September and one in January, were made along Los
Angeles County Sanitation Districts South Slope Trunk, on the seaward slope of the Palos
Verdes Hills (Fig. 5). The sewage was timed by use of dye, and the testing paced the flow.
Flow is essentially by gravity, but there are two siphons, and there is a 5,400-ft length of
above-ground steel pipe of indefinite profile, laid over a creeping landslip. Two lift
stations pumping intermittently into the line were shut off during the January tests. They
were not shut off during the September tests, but it appears that they had little, if any,
effect; they may not have contributed to the sewage tested.
cr
3
O
Q_
<
cr
=f o
<
<
LÜ
Q:
z
LÜ
>X
o
•
%
Λ
O . .
o°
# -
• ·
t
• ·. ·
•
o.
•
100
200
300
400
One-day, 20° C BOD, mg/l
^
•c
•
·· ·'
,o°.·
··
·· · o •
• ·
··
#
" 0
100
200
300
4 0 0
FIVE-DAY, 20° C BOD, mg/l
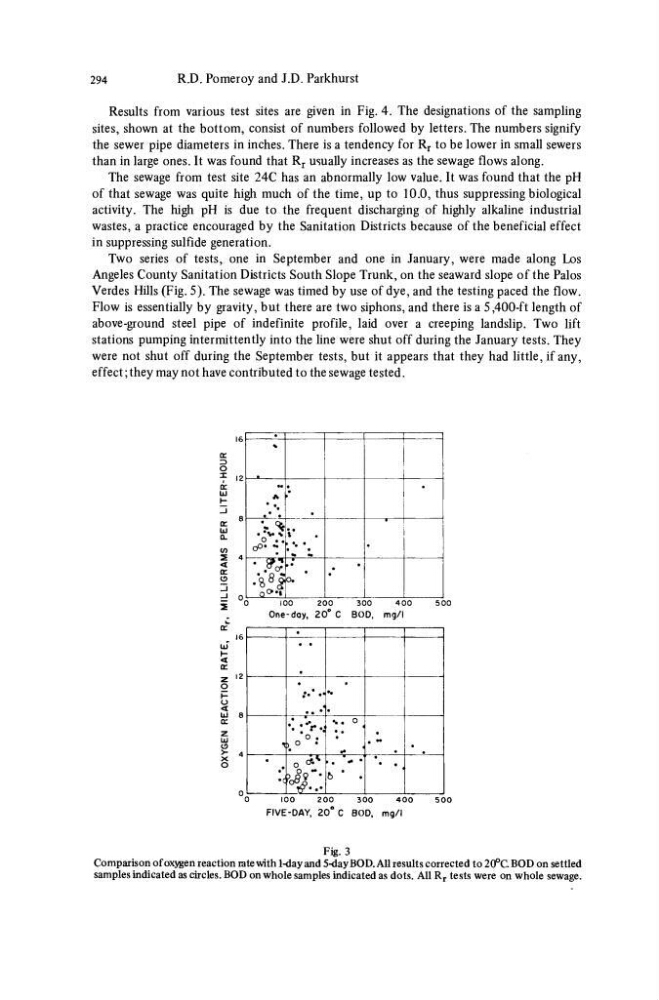
Fig. 3
Comparison of oxygen reaction rate with 1-day and 5-day BOD. All results corrected to 20°C BOD on settled
samples indicated as circles. BOD on whole samples indicated as dots. All R r tests were on whole sewage.
R.D. Pomeroy and J.D. Parkhurst
Results from various test sites are given in Fig. 4. The designations of the sampling
sites, shown at the bottom, consist of numbers followed by letters. The numbers signify
the sewer pipe diameters in inches. There is a tendency for R r to be lower in small sewers
than in large ones. It was found that R r usually increases as the sewage flows along.
The sewage from test site 24C has an abnormally low value. It was found that the pH
of that sewage was quite high much of the time, up to 10.0, thus suppressing biological
activity. The high pH is due to the frequent discharging of highly alkaline industrial
wastes, a practice encouraged by the Sanitation Districts because of the beneficial effect
in suppressing sulfide generation.
Two series of tests, one in September and one in January, were made along Los
Angeles County Sanitation Districts South Slope Trunk, on the seaward slope of the Palos
Verdes Hills (Fig. 5). The sewage was timed by use of dye, and the testing paced the flow.
Flow is essentially by gravity, but there are two siphons, and there is a 5,400-ft length of
above-ground steel pipe of indefinite profile, laid over a creeping landslip. Two lift
stations pumping intermittently into the line were shut off during the January tests. They
were not shut off during the September tests, but it appears that they had little, if any,
effect; they may not have contributed to the sewage tested.
cr
3
O
Q_
<
cr
=f o
<
<
LÜ
Q:
z
LÜ
>X
o
•
%
Λ
O . .
o°
# -
• ·
t
• ·. ·
•
o.
•
100
200
300
400
One-day, 20° C BOD, mg/l
^
•c
•
·· ·'
,o°.·
··
·· · o •
• ·
··
#
" 0
100
200
300
4 0 0
FIVE-DAY, 20° C BOD, mg/l
Fig. 3
Comparison of oxygen reaction rate with 1-day and 5-day BOD. All results corrected to 20°C BOD on settled
samples indicated as circles. BOD on whole samples indicated as dots. All R r tests were on whole sewage.