

Self-Purification in Sewers
293
i.o
uT
a:
0.5
>
<
_J
tr
0
— 0.5
DISSOLVED OXYGEN, mg/l
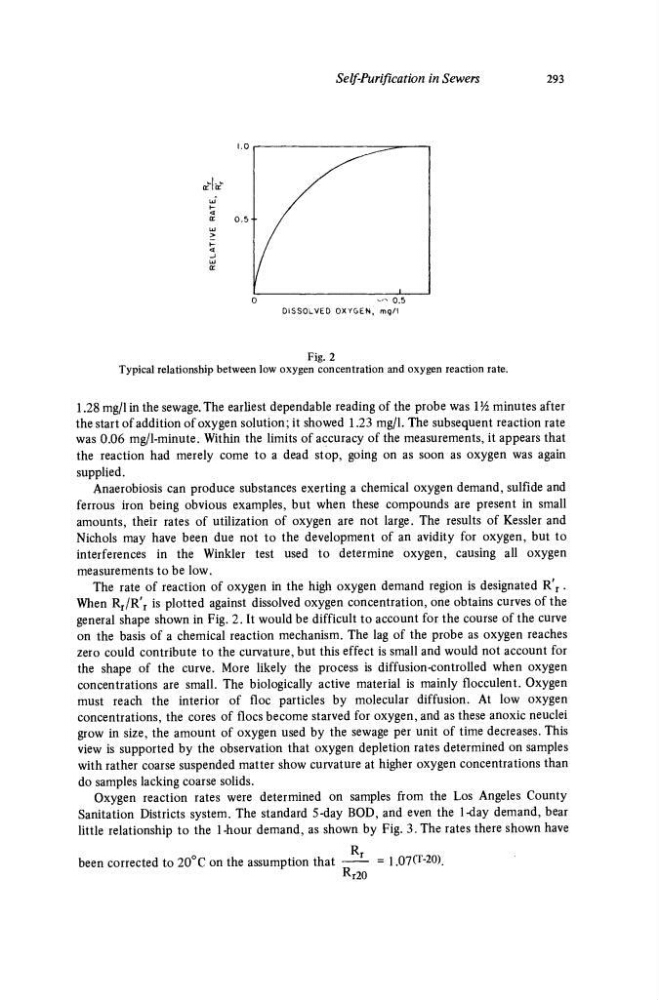
Fig. 2
Typical relationship between low oxygen concentration and oxygen reaction rate.
1.28 mg/l in the sewage. The earliest dependable reading of the probe was \
l A minutes after
the start of addition of oxygen solution; it showed 1.23 mg/l. The subsequent reaction rate
was 0.06 mg/1-minute. Within the limits of accuracy of the measurements, it appears that
the reaction had merely come to a dead stop, going on as soon as oxygen was again
supplied.
Anaerobiosis can produce substances exerting a chemical oxygen demand, sulfide and
ferrous iron being obvious examples, but when these compounds are present in small
amounts, their rates of utilization of oxygen are not large. The results of Kessler and
Nichols may have been due not to the development of an avidity for oxygen, but to
interferences in the Winkler test used to determine oxygen, causing all oxygen
measurements to be low.
The rate of reaction of oxygen in the high oxygen demand region is designated R' r .
When R r /R' r is plotted against dissolved oxygen concentration, one obtains curves of the
general shape shown in Fig. 2. It would be difficult to account for the course of the curve
on the basis of a chemical reaction mechanism. The lag of the probe as oxygen reaches
zero could contribute to the curvature, but this effect is small and would not account for
the shape of the curve. More likely the process is diffusion-controlled when oxygen
concentrations are small. The biologically active material is mainly flocculent. Oxygen
must reach the interior of floe particles by molecular diffusion. At low oxygen
concentrations, the cores of floes become starved for oxygen, and as these anoxic neuclei
grow in size, the amount of oxygen used by the sewage per unit of time decreases. This
view is supported by the observation that oxygen depletion rates determined on samples
with rather coarse suspended matter show curvature at higher oxygen concentrations than
do samples lacking coarse solids.
Oxygen reaction rates were determined on samples from the Los Angeles County
Sanitation Districts system. The standard 5-day BOD, and even the 1-day demand, bear
little relationship to the 1-hour demand, as shown by Fig. 3. The rates there shown have
been corrected to 20°C on the assumption that
= 1 .Ol^'
2 ®).
Rr20
293
i.o
uT
a:
0.5
>
<
_J
tr
0
— 0.5
DISSOLVED OXYGEN, mg/l
Fig. 2
Typical relationship between low oxygen concentration and oxygen reaction rate.
1.28 mg/l in the sewage. The earliest dependable reading of the probe was \
l A minutes after
the start of addition of oxygen solution; it showed 1.23 mg/l. The subsequent reaction rate
was 0.06 mg/1-minute. Within the limits of accuracy of the measurements, it appears that
the reaction had merely come to a dead stop, going on as soon as oxygen was again
supplied.
Anaerobiosis can produce substances exerting a chemical oxygen demand, sulfide and
ferrous iron being obvious examples, but when these compounds are present in small
amounts, their rates of utilization of oxygen are not large. The results of Kessler and
Nichols may have been due not to the development of an avidity for oxygen, but to
interferences in the Winkler test used to determine oxygen, causing all oxygen
measurements to be low.
The rate of reaction of oxygen in the high oxygen demand region is designated R' r .
When R r /R' r is plotted against dissolved oxygen concentration, one obtains curves of the
general shape shown in Fig. 2. It would be difficult to account for the course of the curve
on the basis of a chemical reaction mechanism. The lag of the probe as oxygen reaches
zero could contribute to the curvature, but this effect is small and would not account for
the shape of the curve. More likely the process is diffusion-controlled when oxygen
concentrations are small. The biologically active material is mainly flocculent. Oxygen
must reach the interior of floe particles by molecular diffusion. At low oxygen
concentrations, the cores of floes become starved for oxygen, and as these anoxic neuclei
grow in size, the amount of oxygen used by the sewage per unit of time decreases. This
view is supported by the observation that oxygen depletion rates determined on samples
with rather coarse suspended matter show curvature at higher oxygen concentrations than
do samples lacking coarse solids.
Oxygen reaction rates were determined on samples from the Los Angeles County
Sanitation Districts system. The standard 5-day BOD, and even the 1-day demand, bear
little relationship to the 1-hour demand, as shown by Fig. 3. The rates there shown have
been corrected to 20°C on the assumption that
= 1 .Ol^'
2 ®).
Rr20