

Mathematical Model for the Prediction of Dissolved Oxygen Levels
275
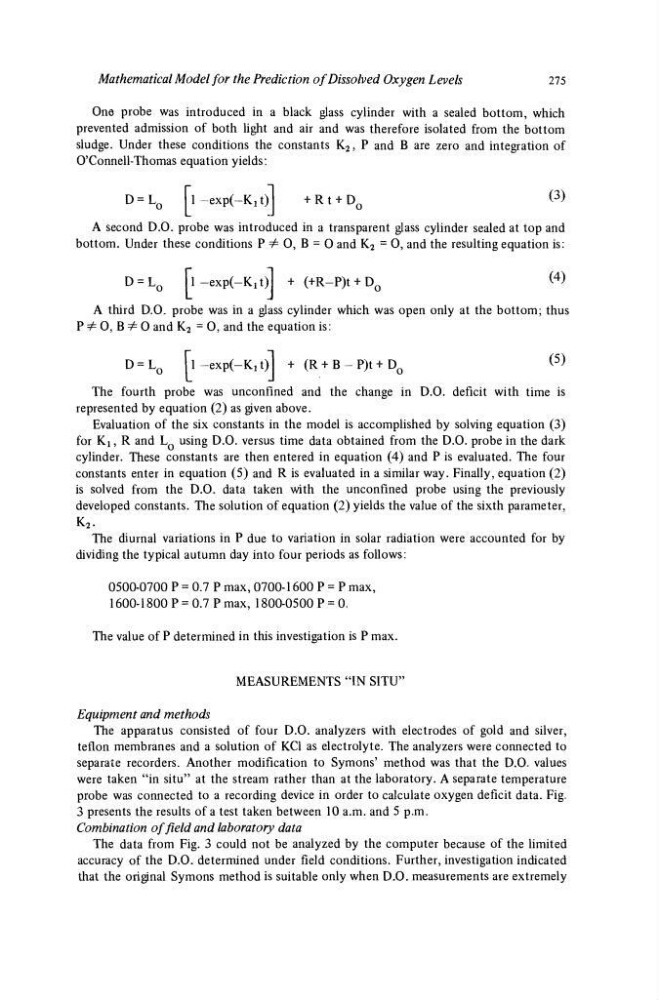
One probe was introduced in a black glass cylinder with a sealed bottom, which
prevented admission of both light and air and was therefore isolated from the bottom
sludge. Under these conditions the constants K 2 , P and B are zero and integration of
O'Connell-Thomas equation yields:
D = L 0 Tl-expHM)]
+Rt + D 0
(3)
A second D.O. probe was introduced in a transparent glass cylinder sealed at top and
bottom. Under these conditions P Φ O, B = O and K 2 = 0, and the resulting equation is:
D = L 0
Γ ΐ - β χ ρ ί - Κ , ΐ ) ! + (+R-P)t + D 0
(4)
A third D.O. probe was in a glass cylinder which was open only at the bottom; thus
P Φ 0, B Φ O and K 2 = O, and the equation is:
D = L Q
T l - e x p i - K ^ ) ] + (R + B - P ) t + D 0
(
5 )
The fourth probe was unconfined and the change in D.O. deficit with time is
represented by equation (2) as given above.
Evaluation of the six constants in the model is accomplished by solving equation (3)
for Kj, R and L Q using D.O. versus time data obtained from the D.O. probe in the dark
cylinder. These constants are then entered in equation (4) and P is evaluated. The four
constants enter in equation (5) and R is evaluated in a similar way. Finally, equation (2)
is solved from the D.O. data taken with the unconfined probe using the previously
developed constants. The solution of equation (2) yields the value of the sixth parameter,
K 2 .
The diurnal variations in P due to variation in solar radiation were accounted for by
dividing the typical autumn day into four periods as follows:
0500-0700 P = 0.7 P max, 0700-1600 P = P max,
1600-1800 P = 0.7 P max, 1800-0500 P = 0.
The value of P determined in this investigation is P max.
MEASUREMENTS "IN SITU"
Equipment and methods
The apparatus consisted of four D.O. analyzers with electrodes of gold and silver,
teflon membranes and a solution of KC1 as electrolyte. The analyzers were connected to
separate recorders. Another modification to Symons' method was that the D.O. values
were taken "in situ" at the stream rather than at the laboratory. A separate temperature
probe was connected to a recording device in order to calculate oxygen deficit data. Fig.
3 presents the results of a test taken between 10 a.m. and 5 p.m.
Combination of field and laboratory data
The data from Fig. 3 could not be analyzed by the computer because of the limited
accuracy of the D.O. determined under field conditions. Further, investigation indicated
that the original Symons method is suitable only when D.O. measurements are extremely
275
One probe was introduced in a black glass cylinder with a sealed bottom, which
prevented admission of both light and air and was therefore isolated from the bottom
sludge. Under these conditions the constants K 2 , P and B are zero and integration of
O'Connell-Thomas equation yields:
D = L 0 Tl-expHM)]
+Rt + D 0
(3)
A second D.O. probe was introduced in a transparent glass cylinder sealed at top and
bottom. Under these conditions P Φ O, B = O and K 2 = 0, and the resulting equation is:
D = L 0
Γ ΐ - β χ ρ ί - Κ , ΐ ) ! + (+R-P)t + D 0
(4)
A third D.O. probe was in a glass cylinder which was open only at the bottom; thus
P Φ 0, B Φ O and K 2 = O, and the equation is:
D = L Q
T l - e x p i - K ^ ) ] + (R + B - P ) t + D 0
(
5 )
The fourth probe was unconfined and the change in D.O. deficit with time is
represented by equation (2) as given above.
Evaluation of the six constants in the model is accomplished by solving equation (3)
for Kj, R and L Q using D.O. versus time data obtained from the D.O. probe in the dark
cylinder. These constants are then entered in equation (4) and P is evaluated. The four
constants enter in equation (5) and R is evaluated in a similar way. Finally, equation (2)
is solved from the D.O. data taken with the unconfined probe using the previously
developed constants. The solution of equation (2) yields the value of the sixth parameter,
K 2 .
The diurnal variations in P due to variation in solar radiation were accounted for by
dividing the typical autumn day into four periods as follows:
0500-0700 P = 0.7 P max, 0700-1600 P = P max,
1600-1800 P = 0.7 P max, 1800-0500 P = 0.
The value of P determined in this investigation is P max.
MEASUREMENTS "IN SITU"
Equipment and methods
The apparatus consisted of four D.O. analyzers with electrodes of gold and silver,
teflon membranes and a solution of KC1 as electrolyte. The analyzers were connected to
separate recorders. Another modification to Symons' method was that the D.O. values
were taken "in situ" at the stream rather than at the laboratory. A separate temperature
probe was connected to a recording device in order to calculate oxygen deficit data. Fig.
3 presents the results of a test taken between 10 a.m. and 5 p.m.
Combination of field and laboratory data
The data from Fig. 3 could not be analyzed by the computer because of the limited
accuracy of the D.O. determined under field conditions. Further, investigation indicated
that the original Symons method is suitable only when D.O. measurements are extremely