

186
G. Shelef, M. Schwarz-and H. Schechter
Table 1 gives the average hourly solar irradiance levels for June and December used in
Equations 1, 2, 5 and 6.
Table 1. Average Hourly Solar Incident Irradiance Values in Jerusalem
during the Experimental Period (gram-calories per cm
2 )
Hour
5 6 7 8 9 10 11 12 13 14 15 16 17 18 19
total
daily
June
3 15 33 52 70 81 90 92 90 82 72 56 37 15 2
789
December
2 14 32 45 52 56 54 44 30 12
341
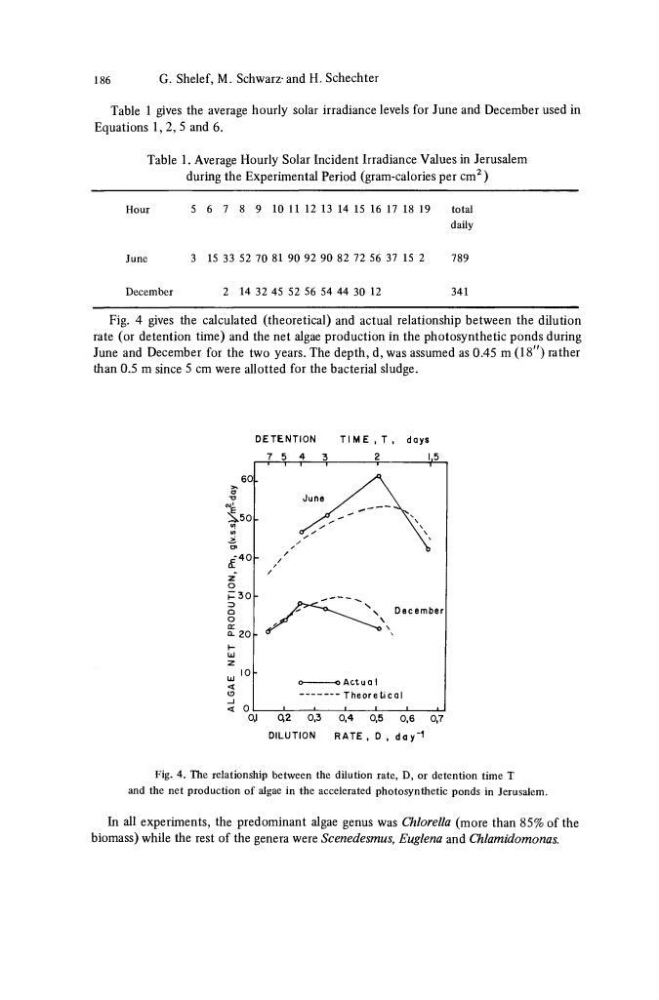
Fig. 4 gives the calculated (theoretical) and actual relationship between the dilution
rate (or detention time) and the net algae production in the photosynthetic ponds during
June and December for the two years. The depth, d, was assumed as 0.45 m (18") rather
than 0.5 m since 5 cm were allotted for the bacterial sludge.
DETENTION
T I M E , T , days
2
lOl·<
< 0
\
December
\
-o Actua I
- - T h e o r e t i c a l
0,1
0,2
0,3
0,4
0,5
0,6
0,7
DILUTION
RATE , D , day"
1
Fig. 4. The relationship between the dilution rate, D, or detention time T
and the net production of algae in the accelerated photosynthetic ponds in Jerusalem.
In all experiments, the predominant algae genus was Chlorella (more than 85% of the
biomass) while the rest of the genera were Scenedesmus, Euglena and Chlamidomonas.
G. Shelef, M. Schwarz-and H. Schechter
Table 1 gives the average hourly solar irradiance levels for June and December used in
Equations 1, 2, 5 and 6.
Table 1. Average Hourly Solar Incident Irradiance Values in Jerusalem
during the Experimental Period (gram-calories per cm
2 )
Hour
5 6 7 8 9 10 11 12 13 14 15 16 17 18 19
total
daily
June
3 15 33 52 70 81 90 92 90 82 72 56 37 15 2
789
December
2 14 32 45 52 56 54 44 30 12
341
Fig. 4 gives the calculated (theoretical) and actual relationship between the dilution
rate (or detention time) and the net algae production in the photosynthetic ponds during
June and December for the two years. The depth, d, was assumed as 0.45 m (18") rather
than 0.5 m since 5 cm were allotted for the bacterial sludge.
DETENTION
T I M E , T , days
2
lOl·<
< 0
\
December
\
-o Actua I
- - T h e o r e t i c a l
0,1
0,2
0,3
0,4
0,5
0,6
0,7
DILUTION
RATE , D , day"
1
Fig. 4. The relationship between the dilution rate, D, or detention time T
and the net production of algae in the accelerated photosynthetic ponds in Jerusalem.
In all experiments, the predominant algae genus was Chlorella (more than 85% of the
biomass) while the rest of the genera were Scenedesmus, Euglena and Chlamidomonas.