

Prediction of Photosynthetic Biomass Production
187
It should be noted that although the irradiance levels in June were more than twice of
those in December (Table 1), the calculated maximum algae production rates were 53.6
g/m
2
-day in June and 30.3 g/m
2 -day in December. This corresponds with the fact that
softer light is being utilized more efficiently than stronger light. Two distinct dilution
rates correspond with the calculated peak algae production, namely, 0.5 day"
1 (1.82
days detention) in June and 0.38 day"
1 (2.64 days detention) in December.
The actual algae production rate did not correspond adequately to the calculated ones
according to the December experiments, particularly in the shorter detention time. The
discrepancy in the higher peak values of the actual production rate in June, is explained
by the higher bacterial suspended matter present due to a too vigorous daytime agitation
at the time of sampling.
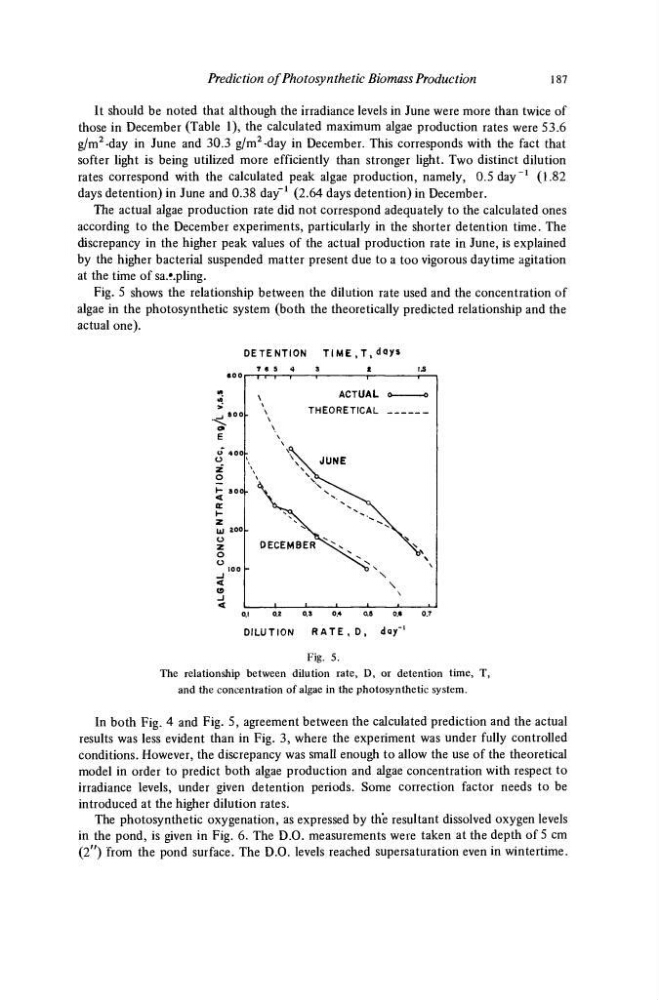
Fig. 5 shows the relationship between the dilution rate used and the concentration of
algae in the photosynthetic system (both the theoretically predicted relationship and the
actual one).
DETENTION
Τ Ι Μ Ε , Τ , day*
7 6 5 4
3
2
\JS
6 0 0
_j 5 0 0
a»
E
O 400
O
z
o
K- 3 0 0
<
or
H
Z
U 200
O
z
o
Ü 100
-J
<
-J
<
0.1
0.2
0.3
0.4
0.6
0.6
0.7
DILUTION
RATE , D, day'
1
Fig. 5.
The relationship between dilution rate, D, or detention time, T,
and the concentration of algae in the photosynthetic system.
In both Fig. 4 and Fig. 5, agreement between the calculated prediction and the actual
results was less evident than in Fig. 3, where the experiment was under fully controlled
conditions. However, the discrepancy was small enough to allow the use of the theoretical
model in order to predict both algae production and algae concentration with respect to
irradiance levels, under given detention periods. Some correction factor needs to be
introduced at the higher dilution rates.
The photosynthetic oxygenation, as expressed by the resultant dissolved oxygen levels
in the pond, is given in Fig. 6. The D.O. measurements were taken at the depth of 5 cm
(2") from the pond surface. The D.O. levels reached supersaturation even in wintertime.
187
It should be noted that although the irradiance levels in June were more than twice of
those in December (Table 1), the calculated maximum algae production rates were 53.6
g/m
2
-day in June and 30.3 g/m
2 -day in December. This corresponds with the fact that
softer light is being utilized more efficiently than stronger light. Two distinct dilution
rates correspond with the calculated peak algae production, namely, 0.5 day"
1 (1.82
days detention) in June and 0.38 day"
1 (2.64 days detention) in December.
The actual algae production rate did not correspond adequately to the calculated ones
according to the December experiments, particularly in the shorter detention time. The
discrepancy in the higher peak values of the actual production rate in June, is explained
by the higher bacterial suspended matter present due to a too vigorous daytime agitation
at the time of sampling.
Fig. 5 shows the relationship between the dilution rate used and the concentration of
algae in the photosynthetic system (both the theoretically predicted relationship and the
actual one).
DETENTION
Τ Ι Μ Ε , Τ , day*
7 6 5 4
3
2
\JS
6 0 0
_j 5 0 0
a»
E
O 400
O
z
o
K- 3 0 0
<
or
H
Z
U 200
O
z
o
Ü 100
-J
<
-J
<
0.1
0.2
0.3
0.4
0.6
0.6
0.7
DILUTION
RATE , D, day'
1
Fig. 5.
The relationship between dilution rate, D, or detention time, T,
and the concentration of algae in the photosynthetic system.
In both Fig. 4 and Fig. 5, agreement between the calculated prediction and the actual
results was less evident than in Fig. 3, where the experiment was under fully controlled
conditions. However, the discrepancy was small enough to allow the use of the theoretical
model in order to predict both algae production and algae concentration with respect to
irradiance levels, under given detention periods. Some correction factor needs to be
introduced at the higher dilution rates.
The photosynthetic oxygenation, as expressed by the resultant dissolved oxygen levels
in the pond, is given in Fig. 6. The D.O. measurements were taken at the depth of 5 cm
(2") from the pond surface. The D.O. levels reached supersaturation even in wintertime.