

Prediction of Photosynthetic Biomass Production
185
From Equations 1,4 and 7, it can be shown that
c
PA
° (M n + K d ) d
(8)
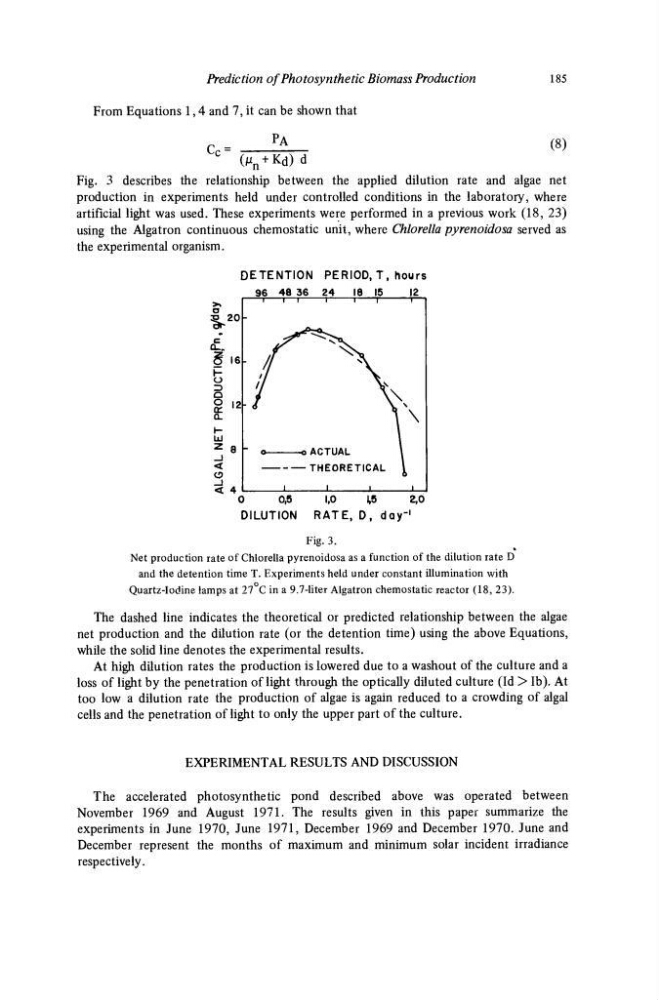
Fig. 3 describes the relationship between the applied dilution rate and algae net
production in experiments held under controlled conditions in the laboratory, where
artificial light was used. These experiments were performed in a previous work (18, 23)
using the Algatron continuous chemostatic unit, where Chlorella pyrenoidosa served as
the experimental organism.
DETENTION PERIOD, T, hours
96 48 36 24
18 J5 _I2_.
0
0,5
DILUTION
1.0
15
2,0
RATE, D, day'
1
Fig. 3.
Net production rate of Chlorella pyrenoidosa as a function of the dilution rate D
and the detention time T. Experiments held under constant illumination with
Quartz-Iodine lamps at 27 C in a 9.7-liter Algatron chemostatic reactor (18, 23).
The dashed line indicates the theoretical or predicted relationship between the algae
net production and the dilution rate (or the detention time) using the above Equations,
while the solid line denotes the experimental results.
At high dilution rates the production is lowered due to a washout of the culture and a
loss of light by the penetration of light through the optically diluted culture (Id > lb). At
too low a dilution rate the production of algae is again reduced to a crowding of algal
cells and the penetration of light to only the upper part of the culture.
EXPERIMENTAL RESULTS AND DISCUSSION
The accelerated photosynthetic pond described above was operated between
November 1969 and August 1971. The results given in this paper summarize the
experiments in June 1970, June 1971, December 1969 and December 1970. June and
December represent the months of maximum and minimum solar incident irradiance
respectively.
185
From Equations 1,4 and 7, it can be shown that
c
PA
° (M n + K d ) d
(8)
Fig. 3 describes the relationship between the applied dilution rate and algae net
production in experiments held under controlled conditions in the laboratory, where
artificial light was used. These experiments were performed in a previous work (18, 23)
using the Algatron continuous chemostatic unit, where Chlorella pyrenoidosa served as
the experimental organism.
DETENTION PERIOD, T, hours
96 48 36 24
18 J5 _I2_.
0
0,5
DILUTION
1.0
15
2,0
RATE, D, day'
1
Fig. 3.
Net production rate of Chlorella pyrenoidosa as a function of the dilution rate D
and the detention time T. Experiments held under constant illumination with
Quartz-Iodine lamps at 27 C in a 9.7-liter Algatron chemostatic reactor (18, 23).
The dashed line indicates the theoretical or predicted relationship between the algae
net production and the dilution rate (or the detention time) using the above Equations,
while the solid line denotes the experimental results.
At high dilution rates the production is lowered due to a washout of the culture and a
loss of light by the penetration of light through the optically diluted culture (Id > lb). At
too low a dilution rate the production of algae is again reduced to a crowding of algal
cells and the penetration of light to only the upper part of the culture.
EXPERIMENTAL RESULTS AND DISCUSSION
The accelerated photosynthetic pond described above was operated between
November 1969 and August 1971. The results given in this paper summarize the
experiments in June 1970, June 1971, December 1969 and December 1970. June and
December represent the months of maximum and minimum solar incident irradiance
respectively.