

the atmosphere, but the southwestern part of the basin was a CO 2 sink
because of its higher biological activity, as corroborated by the high
oxygen concentrations.
The vertical distribution of C
ant
concentrations is related to the
distribution of the main water masses and their respective ages.
Nevertheless, this distribution is locally affected by active mesoscale
and submesoscale processes in the AB, processes that play an important
role in enhancing carbon transport to deep waters. This paper also
shows that the two tested approaches (MCM and TrOCA) yield relatively similar C
ant
distributions and concentration ranges
(~50–115 μmol/kg). Nevertheless, the MCM requires a proper parametrization of the preindustrial air-sea disequilibrium because the
latter generates high uncertainties on C
ant
concentration estimates in
the AB. Moreover, the preindustrial parametrization of DIC (C
0,PI
) has
to be assessed more rigorously for deep and intermediate waters, such
as by including winter measurements of carbonate system parameters
in the area of deep and intermediate water formation.
The sequestered C
ant
inventory of the AB is about 0.44–0.53 ± 0.06
Pg C (from the preindustrial era to 2014) and is mainly conditioned by
the intrinsic characteristics of the MS, the bathymetry, and mesoscale
processes in the region (anticyclonic eddies). The accumulation of C
ant
due to the increasing atmospheric CO 2 concentrations and the quick
renewal of deep waters (2005–2013) caused an acidification ranging
from −0.19 to −0.1 pH units. Nevertheless, the AB waters remain
oversaturated with respect to calcite and aragonite. This oversaturation
will probably persist as the increase of sea surface temperatures partially compensates for the acidification.
Declaration of competing interest
None.
Acknowledgments
The SOMBA-GE cruise was the product of an Algerian/French collaboration under the MerMex program, promoted by the I-MOOSE initiative within the framework of MISTRALS. We thank the captains and
crew of the R/V Téthys, Benyahia Boudjellal, and Azzouz Mekki for
their commitment on-board. We are particularly grateful to the SNAPOCO 2 laboratory, especially Jonathan Fin, Claire Lo Monaco, and Nicolas
Metzl for their high quality measurements. We would also like to thank
Dr. Sofiane Soukane for his help on a previous version of the manuscript. Comments from the two anonymous, journal reviewers and
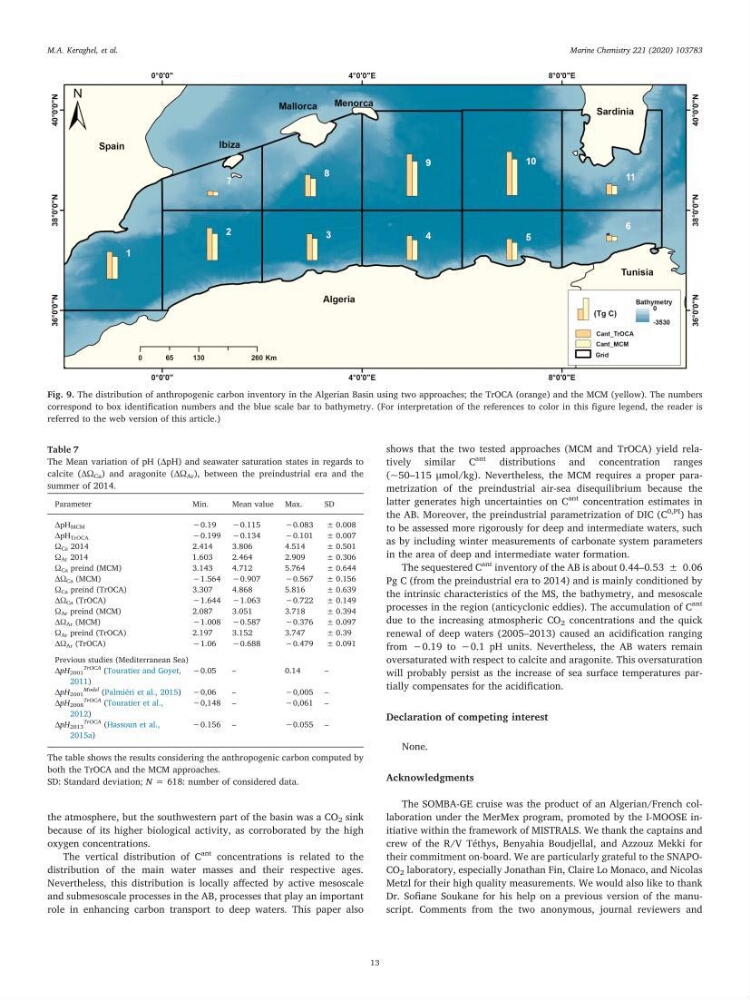
Fig. 9. The distribution of anthropogenic carbon inventory in the Algerian Basin using two approaches; the TrOCA (orange) and the MCM (yellow). The numbers
correspond to box identification numbers and the blue scale bar to bathymetry. (For interpretation of the references to color in this figure legend, the reader is
referred to the web version of this article.)
Table 7
The Mean variation of pH (ΔpH) and seawater saturation states in regards to
calcite (ΔΩ Ca ) and aragonite (ΔΩ Ar ), between the preindustrial era and the
summer of 2014.
Parameter
Min.
Mean value Max.
SD
ΔpH MCM
−0.19
−0.115
−0.083
± 0.008
ΔpH TrOCA
−0.199 −0.134
−0.101
± 0.007
Ω Ca 2014
2.414
3.806
4.514
± 0.501
Ω Ar 2014
1.603
2.464
2.909
± 0.306
Ω Ca preind (MCM)
3.143
4.712
5.764
± 0.644
ΔΩ Ca (MCM)
−1.564 −0.907
−0.567
± 0.156
Ω Ca preind (TrOCA)
3.307
4.868
5.816
± 0.639
ΔΩ Ca (TrOCA)
−1.644 −1.063
−0.722
± 0.149
Ω Ar preind (MCM)
2.087
3.051
3.718
± 0.394
ΔΩ Ar (MCM)
−1.008 −0.587
−0.376
± 0.097
Ω Ar preind (TrOCA)
2.197
3.152
3.747
± 0.39
ΔΩ Ar (TrOCA)
−1.06
−0.688
−0.479
± 0.091
Previous studies (Mediterranean Sea)
∆pH 2001
TrOCA (Touratier and Goyet,
2011)
−0.05
–
0.14
–
∆pH 2001
Model (Palmiéri et al., 2015) −0,06
–
−0,005 –
∆pH 2008
TrOCA (Touratier et al.,
2012)
−0,148 –
−0,061 –
∆pH 2013
TrOCA (Hassoun et al.,
2015a)
−0.156 –
−0.055 –
The table shows the results considering the anthropogenic carbon computed by
both the TrOCA and the MCM approaches.
SD: Standard deviation; N = 618: number of considered data.
M.A. Keraghel, et al.
Marine Chemistry 221 (2020) 103783
13
because of its higher biological activity, as corroborated by the high
oxygen concentrations.
The vertical distribution of C
ant
concentrations is related to the
distribution of the main water masses and their respective ages.
Nevertheless, this distribution is locally affected by active mesoscale
and submesoscale processes in the AB, processes that play an important
role in enhancing carbon transport to deep waters. This paper also
shows that the two tested approaches (MCM and TrOCA) yield relatively similar C
ant
distributions and concentration ranges
(~50–115 μmol/kg). Nevertheless, the MCM requires a proper parametrization of the preindustrial air-sea disequilibrium because the
latter generates high uncertainties on C
ant
concentration estimates in
the AB. Moreover, the preindustrial parametrization of DIC (C
0,PI
) has
to be assessed more rigorously for deep and intermediate waters, such
as by including winter measurements of carbonate system parameters
in the area of deep and intermediate water formation.
The sequestered C
ant
inventory of the AB is about 0.44–0.53 ± 0.06
Pg C (from the preindustrial era to 2014) and is mainly conditioned by
the intrinsic characteristics of the MS, the bathymetry, and mesoscale
processes in the region (anticyclonic eddies). The accumulation of C
ant
due to the increasing atmospheric CO 2 concentrations and the quick
renewal of deep waters (2005–2013) caused an acidification ranging
from −0.19 to −0.1 pH units. Nevertheless, the AB waters remain
oversaturated with respect to calcite and aragonite. This oversaturation
will probably persist as the increase of sea surface temperatures partially compensates for the acidification.
Declaration of competing interest
None.
Acknowledgments
The SOMBA-GE cruise was the product of an Algerian/French collaboration under the MerMex program, promoted by the I-MOOSE initiative within the framework of MISTRALS. We thank the captains and
crew of the R/V Téthys, Benyahia Boudjellal, and Azzouz Mekki for
their commitment on-board. We are particularly grateful to the SNAPOCO 2 laboratory, especially Jonathan Fin, Claire Lo Monaco, and Nicolas
Metzl for their high quality measurements. We would also like to thank
Dr. Sofiane Soukane for his help on a previous version of the manuscript. Comments from the two anonymous, journal reviewers and
Fig. 9. The distribution of anthropogenic carbon inventory in the Algerian Basin using two approaches; the TrOCA (orange) and the MCM (yellow). The numbers
correspond to box identification numbers and the blue scale bar to bathymetry. (For interpretation of the references to color in this figure legend, the reader is
referred to the web version of this article.)
Table 7
The Mean variation of pH (ΔpH) and seawater saturation states in regards to
calcite (ΔΩ Ca ) and aragonite (ΔΩ Ar ), between the preindustrial era and the
summer of 2014.
Parameter
Min.
Mean value Max.
SD
ΔpH MCM
−0.19
−0.115
−0.083
± 0.008
ΔpH TrOCA
−0.199 −0.134
−0.101
± 0.007
Ω Ca 2014
2.414
3.806
4.514
± 0.501
Ω Ar 2014
1.603
2.464
2.909
± 0.306
Ω Ca preind (MCM)
3.143
4.712
5.764
± 0.644
ΔΩ Ca (MCM)
−1.564 −0.907
−0.567
± 0.156
Ω Ca preind (TrOCA)
3.307
4.868
5.816
± 0.639
ΔΩ Ca (TrOCA)
−1.644 −1.063
−0.722
± 0.149
Ω Ar preind (MCM)
2.087
3.051
3.718
± 0.394
ΔΩ Ar (MCM)
−1.008 −0.587
−0.376
± 0.097
Ω Ar preind (TrOCA)
2.197
3.152
3.747
± 0.39
ΔΩ Ar (TrOCA)
−1.06
−0.688
−0.479
± 0.091
Previous studies (Mediterranean Sea)
∆pH 2001
TrOCA (Touratier and Goyet,
2011)
−0.05
–
0.14
–
∆pH 2001
Model (Palmiéri et al., 2015) −0,06
–
−0,005 –
∆pH 2008
TrOCA (Touratier et al.,
2012)
−0,148 –
−0,061 –
∆pH 2013
TrOCA (Hassoun et al.,
2015a)
−0.156 –
−0.055 –
The table shows the results considering the anthropogenic carbon computed by
both the TrOCA and the MCM approaches.
SD: Standard deviation; N = 618: number of considered data.
M.A. Keraghel, et al.
Marine Chemistry 221 (2020) 103783
13