

3.4. Acidification estimates and CaCO 3 saturation
The difference in pH from the preindustrial era to summer 2014
confirms the high acidification of the AB, with ΔpH values ranging from
−0.19 to −0.1 pH unit and a mean value of −0.12 ± 0.008 pH unit
(~ −0.0005 pH unit. yr
−1
) (Table 7). The two approaches used to
estimate C
ant
concentrations yield a similar pH decrease with a mean
difference of about 0.01 pH units—almost within the range of the
corresponding standard deviations. According to Marcellin Yao et al.
(2016), the increasing atmospheric CO 2 accounts for 70% of the decrease in surface pH at the deep-water formation site while the remaining 30% is caused by increasing seawater temperatures. Fig. 10
illustrates the distribution of ΔpH along the east-west section of the
SOMBA cruise, which is strongly correlated with the C
ant
distribution.
The oldest water masses (LIWs) are characterized by the lowest acidification, while the newest are enriched with C
ant
and are the most
acidified waters. The anticyclonic eddy at 6°E has an acidification of
about −0.13 (MCM) to −0.16 pH unit (TrOCA), probably caused by
the submesoscale activity mentioned earlier. It is difficult to conclude
on the evolution of the acidification based on a comparison of our results with the literature (Hassoun et al., 2015a; Touratier et al., 2012;
Touratier and Goyet, 2011) (Table 7). The previous acidification estimates considered the entire MS, while this study focuses solely on the
AB, which is more acidified than the MS' eastern basin (e.g., Hassoun
et al., 2015a; Touratier and Goyet, 2011).
The saturation states of waters with respect to calcite (Ω ca ) and
aragonite (Ω ar ) are defined by:
=
×
+
Ca
CO
K
[
]
[
]
ca ar
ca ar
( )
2
3
2
( )
(15)
where K
⁎
is the stoichiometric solubility product and [Ca
2+
] and
[CO 3
2−
] are the total calcium and carbonate ion concentrations, respectively.
Variations of the calcite and aragonite saturation states (ΔΩ ca and
ΔΩ ar , respectively) were calculated by subtracting the calculated values
for the summer of 2014 from the preindustrial values. The mean values
of ΔΩ Ca and ΔΩ ar are −0.9 to −1.06 ± 0.15 for calcite and − 0.59 to
−0.69 ± 0.09 for aragonite (Table 7). These results are consistent
with those of Hassoun et al. (2015a). Nevertheless, despite the important acidification of the basin, Table 7 clearly shows that waters of
the AB remain oversaturated with respect to calcite and aragonite
throughout its water column, with mean saturation states of 2.4–4.5
and 1.6–2.9, respectively. These results agree with those of Álvarez
et al. (2014) and Hassoun et al. (2015a) in the MS, and Chen et al.
(2006b) in the South China Sea. In marginal seas, where waters have
lower temperatures and TA than the MS, carbonate mineral undersaturation can be observed below 1000 m (e.g., Chen et al., 1995). Near
calcite and aragonite saturation states were observed in the western MS
(Ω Ca = 2.5 and Ω Ar = 1.5) during a cruise in 1976 (Millero et al.,
1979). According to our results, CaCO 3 oversaturation in the MS will
probably persist for a few more centuries (Goyet et al., 2016). The increase in the CaCO 3 saturation state of waters caused by temperature
increase will partly compensate for water acidification as the stoichiometric solubility product of calcium carbonate (K
⁎
) decreases with
increasing temperatures caused by global warming, and the faster
temperature increase in the MS.
4. Conclusion
This study, the first to cover the AB in its entirety, was based on a
new dataset collected in the summer of 2014 (SOMBA cruise) to better
understand the carbonate chemistry and distribution of C
ant
in the AB.
It revealed the influence of biological activity on the distribution patterns of TA and DIC (e.g., photosynthesis and remineralization), in
addition to the well-known surface east-west and south-north gradients
in the basin. During the summer of 2014, the AB was a source of CO 2 to
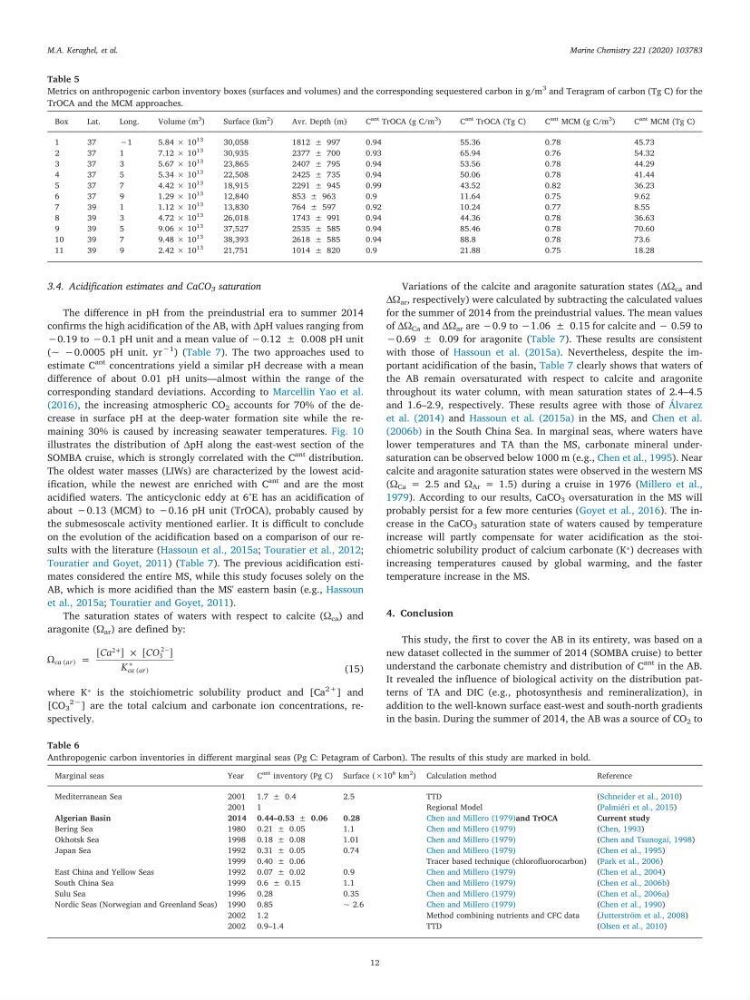
Table 5
Metrics on anthropogenic carbon inventory boxes (surfaces and volumes) and the corresponding sequestered carbon in g/m
3
and Teragram of carbon (Tg C) for the
TrOCA and the MCM approaches.
Box
Lat.
Long.
Volume (m
3
)
Surface (km
2 )
Avr. Depth (m)
C
ant TrOCA (g C/m
3
)
C
ant TrOCA (Tg C)
C
ant MCM (g C/m
3
)
C
ant MCM (Tg C)
1
37
−1
5.84 × 10
13
30,058
1812 ± 997
0.94
55.36
0.78
45.73
2
37
1
7.12 × 10
13
30,935
2377 ± 700
0.93
65.94
0.76
54.32
3
37
3
5.67 × 10
13
23,865
2407 ± 795
0.94
53.56
0.78
44.29
4
37
5
5.34 × 10
13
22,508
2425 ± 735
0.94
50.06
0.78
41.44
5
37
7
4.42 × 10
13
18,915
2291 ± 945
0.99
43.52
0.82
36.23
6
37
9
1.29 × 10
13
12,840
853 ± 963
0.9
11.64
0.75
9.62
7
39
1
1.12 × 10
13
13,830
764 ± 597
0.92
10.24
0.77
8.55
8
39
3
4.72 × 10
13
26,018
1743 ± 991
0.94
44.36
0.78
36.63
9
39
5
9.06 × 10
13
37,527
2535 ± 585
0.94
85.46
0.78
70.60
10
39
7
9.48 × 10
13
38,393
2618 ± 585
0.94
88.8
0.78
73.6
11
39
9
2.42 × 10
13
21,751
1014 ± 820
0.9
21.88
0.75
18.28
Table 6
Anthropogenic carbon inventories in different marginal seas (Pg C: Petagram of Carbon). The results of this study are marked in bold.
Marginal seas
Year
C
ant inventory (Pg C) Surface (×10
6 km
2
) Calculation method
Reference
Mediterranean Sea
2001 1.7 ± 0.4
2.5
TTD
(Schneider et al., 2010)
2001 1
Regional Model
(Palmiéri et al., 2015)
Algerian Basin
2014 0.44–0.53 ± 0.06
0.28
Chen and Millero (1979)and TrOCA
Current study
Bering Sea
1980 0.21 ± 0.05
1.1
Chen and Millero (1979)
(Chen, 1993)
Okhotsk Sea
1998 0.18 ± 0.08
1.01
Chen and Millero (1979)
(Chen and Tsunogai, 1998)
Japan Sea
1992 0.31 ± 0.05
0.74
Chen and Millero (1979)
(Chen et al., 1995)
1999 0.40 ± 0.06
Tracer based technique (chlorofluorocarbon) (Park et al., 2006)
East China and Yellow Seas
1992 0.07 ± 0.02
0.9
Chen and Millero (1979)
(Chen et al., 2004)
South China Sea
1999 0.6 ± 0.15
1.1
Chen and Millero (1979)
(Chen et al., 2006b)
Sulu Sea
1996 0.28
0.35
Chen and Millero (1979)
(Chen et al., 2006a)
Nordic Seas (Norwegian and Greenland Seas) 1990 0.85
~ 2.6
Chen and Millero (1979)
(Chen et al., 1990)
2002 1.2
Method combining nutrients and CFC data
(Jutterström et al., 2008)
2002 0.9–1.4
TTD
(Olsen et al., 2010)
M.A. Keraghel, et al.
Marine Chemistry 221 (2020) 103783
12
The difference in pH from the preindustrial era to summer 2014
confirms the high acidification of the AB, with ΔpH values ranging from
−0.19 to −0.1 pH unit and a mean value of −0.12 ± 0.008 pH unit
(~ −0.0005 pH unit. yr
−1
) (Table 7). The two approaches used to
estimate C
ant
concentrations yield a similar pH decrease with a mean
difference of about 0.01 pH units—almost within the range of the
corresponding standard deviations. According to Marcellin Yao et al.
(2016), the increasing atmospheric CO 2 accounts for 70% of the decrease in surface pH at the deep-water formation site while the remaining 30% is caused by increasing seawater temperatures. Fig. 10
illustrates the distribution of ΔpH along the east-west section of the
SOMBA cruise, which is strongly correlated with the C
ant
distribution.
The oldest water masses (LIWs) are characterized by the lowest acidification, while the newest are enriched with C
ant
and are the most
acidified waters. The anticyclonic eddy at 6°E has an acidification of
about −0.13 (MCM) to −0.16 pH unit (TrOCA), probably caused by
the submesoscale activity mentioned earlier. It is difficult to conclude
on the evolution of the acidification based on a comparison of our results with the literature (Hassoun et al., 2015a; Touratier et al., 2012;
Touratier and Goyet, 2011) (Table 7). The previous acidification estimates considered the entire MS, while this study focuses solely on the
AB, which is more acidified than the MS' eastern basin (e.g., Hassoun
et al., 2015a; Touratier and Goyet, 2011).
The saturation states of waters with respect to calcite (Ω ca ) and
aragonite (Ω ar ) are defined by:
=
×
+
Ca
CO
K
[
]
[
]
ca ar
ca ar
( )
2
3
2
( )
(15)
where K
⁎
is the stoichiometric solubility product and [Ca
2+
] and
[CO 3
2−
] are the total calcium and carbonate ion concentrations, respectively.
Variations of the calcite and aragonite saturation states (ΔΩ ca and
ΔΩ ar , respectively) were calculated by subtracting the calculated values
for the summer of 2014 from the preindustrial values. The mean values
of ΔΩ Ca and ΔΩ ar are −0.9 to −1.06 ± 0.15 for calcite and − 0.59 to
−0.69 ± 0.09 for aragonite (Table 7). These results are consistent
with those of Hassoun et al. (2015a). Nevertheless, despite the important acidification of the basin, Table 7 clearly shows that waters of
the AB remain oversaturated with respect to calcite and aragonite
throughout its water column, with mean saturation states of 2.4–4.5
and 1.6–2.9, respectively. These results agree with those of Álvarez
et al. (2014) and Hassoun et al. (2015a) in the MS, and Chen et al.
(2006b) in the South China Sea. In marginal seas, where waters have
lower temperatures and TA than the MS, carbonate mineral undersaturation can be observed below 1000 m (e.g., Chen et al., 1995). Near
calcite and aragonite saturation states were observed in the western MS
(Ω Ca = 2.5 and Ω Ar = 1.5) during a cruise in 1976 (Millero et al.,
1979). According to our results, CaCO 3 oversaturation in the MS will
probably persist for a few more centuries (Goyet et al., 2016). The increase in the CaCO 3 saturation state of waters caused by temperature
increase will partly compensate for water acidification as the stoichiometric solubility product of calcium carbonate (K
⁎
) decreases with
increasing temperatures caused by global warming, and the faster
temperature increase in the MS.
4. Conclusion
This study, the first to cover the AB in its entirety, was based on a
new dataset collected in the summer of 2014 (SOMBA cruise) to better
understand the carbonate chemistry and distribution of C
ant
in the AB.
It revealed the influence of biological activity on the distribution patterns of TA and DIC (e.g., photosynthesis and remineralization), in
addition to the well-known surface east-west and south-north gradients
in the basin. During the summer of 2014, the AB was a source of CO 2 to
Table 5
Metrics on anthropogenic carbon inventory boxes (surfaces and volumes) and the corresponding sequestered carbon in g/m
3
and Teragram of carbon (Tg C) for the
TrOCA and the MCM approaches.
Box
Lat.
Long.
Volume (m
3
)
Surface (km
2 )
Avr. Depth (m)
C
ant TrOCA (g C/m
3
)
C
ant TrOCA (Tg C)
C
ant MCM (g C/m
3
)
C
ant MCM (Tg C)
1
37
−1
5.84 × 10
13
30,058
1812 ± 997
0.94
55.36
0.78
45.73
2
37
1
7.12 × 10
13
30,935
2377 ± 700
0.93
65.94
0.76
54.32
3
37
3
5.67 × 10
13
23,865
2407 ± 795
0.94
53.56
0.78
44.29
4
37
5
5.34 × 10
13
22,508
2425 ± 735
0.94
50.06
0.78
41.44
5
37
7
4.42 × 10
13
18,915
2291 ± 945
0.99
43.52
0.82
36.23
6
37
9
1.29 × 10
13
12,840
853 ± 963
0.9
11.64
0.75
9.62
7
39
1
1.12 × 10
13
13,830
764 ± 597
0.92
10.24
0.77
8.55
8
39
3
4.72 × 10
13
26,018
1743 ± 991
0.94
44.36
0.78
36.63
9
39
5
9.06 × 10
13
37,527
2535 ± 585
0.94
85.46
0.78
70.60
10
39
7
9.48 × 10
13
38,393
2618 ± 585
0.94
88.8
0.78
73.6
11
39
9
2.42 × 10
13
21,751
1014 ± 820
0.9
21.88
0.75
18.28
Table 6
Anthropogenic carbon inventories in different marginal seas (Pg C: Petagram of Carbon). The results of this study are marked in bold.
Marginal seas
Year
C
ant inventory (Pg C) Surface (×10
6 km
2
) Calculation method
Reference
Mediterranean Sea
2001 1.7 ± 0.4
2.5
TTD
(Schneider et al., 2010)
2001 1
Regional Model
(Palmiéri et al., 2015)
Algerian Basin
2014 0.44–0.53 ± 0.06
0.28
Chen and Millero (1979)and TrOCA
Current study
Bering Sea
1980 0.21 ± 0.05
1.1
Chen and Millero (1979)
(Chen, 1993)
Okhotsk Sea
1998 0.18 ± 0.08
1.01
Chen and Millero (1979)
(Chen and Tsunogai, 1998)
Japan Sea
1992 0.31 ± 0.05
0.74
Chen and Millero (1979)
(Chen et al., 1995)
1999 0.40 ± 0.06
Tracer based technique (chlorofluorocarbon) (Park et al., 2006)
East China and Yellow Seas
1992 0.07 ± 0.02
0.9
Chen and Millero (1979)
(Chen et al., 2004)
South China Sea
1999 0.6 ± 0.15
1.1
Chen and Millero (1979)
(Chen et al., 2006b)
Sulu Sea
1996 0.28
0.35
Chen and Millero (1979)
(Chen et al., 2006a)
Nordic Seas (Norwegian and Greenland Seas) 1990 0.85
~ 2.6
Chen and Millero (1979)
(Chen et al., 1990)
2002 1.2
Method combining nutrients and CFC data
(Jutterström et al., 2008)
2002 0.9–1.4
TTD
(Olsen et al., 2010)
M.A. Keraghel, et al.
Marine Chemistry 221 (2020) 103783
12