

the Global Ocean (Chen et al., 2006a).
Fig. 9 shows the horizontal distribution of the C
ant
inventory in the
AB using the two selected approaches in this study (TrOCA and MCM).
The lowest sequestered amounts (9–22 Tg C) are observed in the Sardinian Channel and near Ibiza Island, while the highest correspond with
the boxes that have the largest volumes (maximum in box 10 with
74–89 Tg C). These results are consistent with Palmiéri et al. (2015)’s
observation of an important correlation with bathymetry. The highest
concentrations of C
ant
per unit volume are observed in the southern and
central parts of the AB (0.82 g.m
−3
(MCM)–0.99 g.m
−3
(TrOCA))
(Table 5). The inventory maxima encountered at these longitudes
possibly reflect the active anticyclonic activity in the area. According to
Pessini et al. (2018), the southern part of the basin hosts longer-lived
eddies that form and terminate between 4.5°E and 6.5°E.
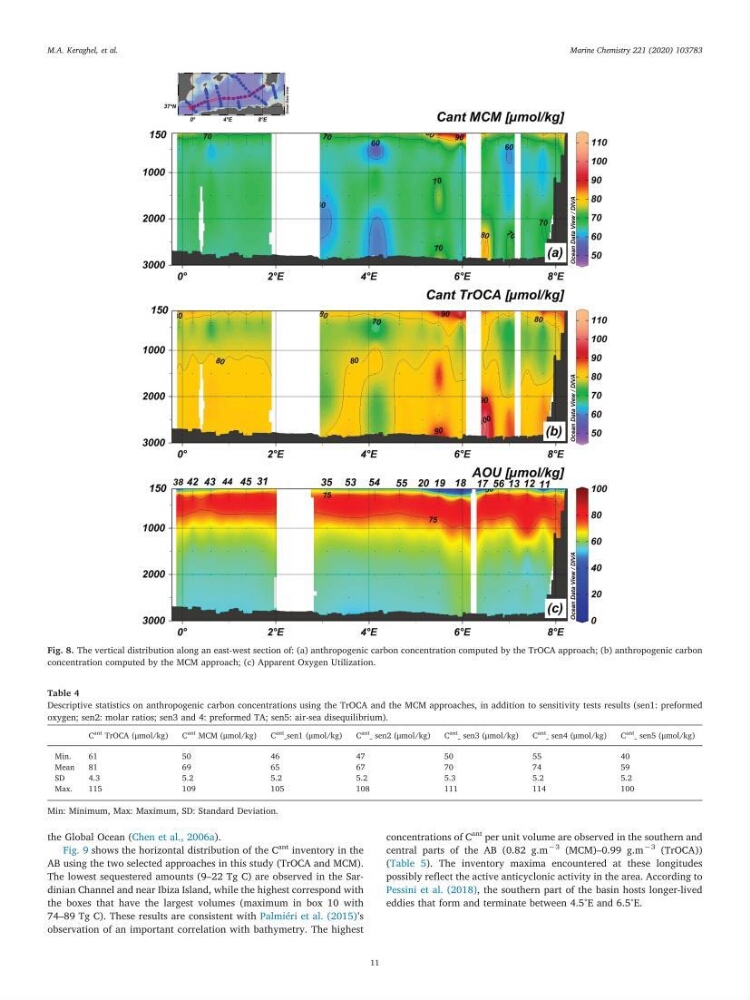
Fig. 8. The vertical distribution along an east-west section of: (a) anthropogenic carbon concentration computed by the TrOCA approach; (b) anthropogenic carbon
concentration computed by the MCM approach; (c) Apparent Oxygen Utilization.
Table 4
Descriptive statistics on anthropogenic carbon concentrations using the TrOCA and the MCM approaches, in addition to sensitivity tests results (sen1: preformed
oxygen; sen2: molar ratios; sen3 and 4: preformed TA; sen5: air-sea disequilibrium).
C
ant TrOCA (μmol/kg)
C
ant MCM (μmol/kg)
C
ant _sen1 (μmol/kg)
C
ant
_ sen2 (μmol/kg)
C
ant _ sen3 (μmol/kg)
C
ant _ sen4 (μmol/kg)
C
ant
_ sen5 (μmol/kg)
Min.
61
50
46
47
50
55
40
Mean
81
69
65
67
70
74
59
SD
4.3
5.2
5.2
5.2
5.3
5.2
5.2
Max.
115
109
105
108
111
114
100
Min: Minimum, Max: Maximum, SD: Standard Deviation.
M.A. Keraghel, et al.
Marine Chemistry 221 (2020) 103783
11
Fig. 9 shows the horizontal distribution of the C
ant
inventory in the
AB using the two selected approaches in this study (TrOCA and MCM).
The lowest sequestered amounts (9–22 Tg C) are observed in the Sardinian Channel and near Ibiza Island, while the highest correspond with
the boxes that have the largest volumes (maximum in box 10 with
74–89 Tg C). These results are consistent with Palmiéri et al. (2015)’s
observation of an important correlation with bathymetry. The highest
concentrations of C
ant
per unit volume are observed in the southern and
central parts of the AB (0.82 g.m
−3
(MCM)–0.99 g.m
−3
(TrOCA))
(Table 5). The inventory maxima encountered at these longitudes
possibly reflect the active anticyclonic activity in the area. According to
Pessini et al. (2018), the southern part of the basin hosts longer-lived
eddies that form and terminate between 4.5°E and 6.5°E.
Fig. 8. The vertical distribution along an east-west section of: (a) anthropogenic carbon concentration computed by the TrOCA approach; (b) anthropogenic carbon
concentration computed by the MCM approach; (c) Apparent Oxygen Utilization.
Table 4
Descriptive statistics on anthropogenic carbon concentrations using the TrOCA and the MCM approaches, in addition to sensitivity tests results (sen1: preformed
oxygen; sen2: molar ratios; sen3 and 4: preformed TA; sen5: air-sea disequilibrium).
C
ant TrOCA (μmol/kg)
C
ant MCM (μmol/kg)
C
ant _sen1 (μmol/kg)
C
ant
_ sen2 (μmol/kg)
C
ant _ sen3 (μmol/kg)
C
ant _ sen4 (μmol/kg)
C
ant
_ sen5 (μmol/kg)
Min.
61
50
46
47
50
55
40
Mean
81
69
65
67
70
74
59
SD
4.3
5.2
5.2
5.2
5.3
5.2
5.2
Max.
115
109
105
108
111
114
100
Min: Minimum, Max: Maximum, SD: Standard Deviation.
M.A. Keraghel, et al.
Marine Chemistry 221 (2020) 103783
11