

parameters (NTA, NDIC) (Fig. 7c and d) and a distinct northward decreasing gradient for the NDIC (Fig. 7h). These gradients persist for
NDIC in the intermediate layer due to higher organic matter remineralization in older waters. However, the NTA distribution does not show
a significant gradient because biological processes do not impact it
much. The non-normalized TA and DIC distributions display an eastward gradient in the intermediate and deep waters. This finding contrasts with Lovato and Vichi (2015) and Cossarini et al. (2015), who
reported that the eastward gradient of TA and DIC disappears at a depth
of 250 m. Deep waters present only small variations with eastward
trends within the uncertainty range for both the normalized and nonnormalized data.
3.3. Anthropogenic carbon
3.3.1. Anthropogenic carbon distribution
Fig. 8 shows the C
ant
concentration estimates from the two
approaches. The concentrations are different but display similar spatial
distributions. Generally, they reach the highest values in the upper
layer (150–250 m) that is in direct contact with the enriched surface
waters (TrOCA:70–115 μmol/kg; MCM: 59–109 μmol/kg). The inflow
of old LIWs to the western MS basin in the intermediate layer
(400–1000 m) is characterized by the lowest C
ant
concentrations
(TrOCA: 61–99 μmol/kg; MCM: 50–91 μmol/kg). These concentrations
increase in deep waters that are continuously renewed by deep-water
formation processes in the Gulf of Lion (TrOCA: 69–100 μmol/kg;
MCM: 56–83 μmol/kg). Recently, Touratier et al. (2016) provided additional insights about the important role of deep-water formation
(convection, cascading) on C
ant
sequestration in the western MS.
The observed values, similar to those of Hassoun et al. (2015a)’s for
the MS in 2013, are higher than earlier estimates (Touratier and Goyet,
2011; Touratier et al., 2012). This increasing trend can be explained by
the increasing concentrations of atmospheric and surface water CO 2 ,
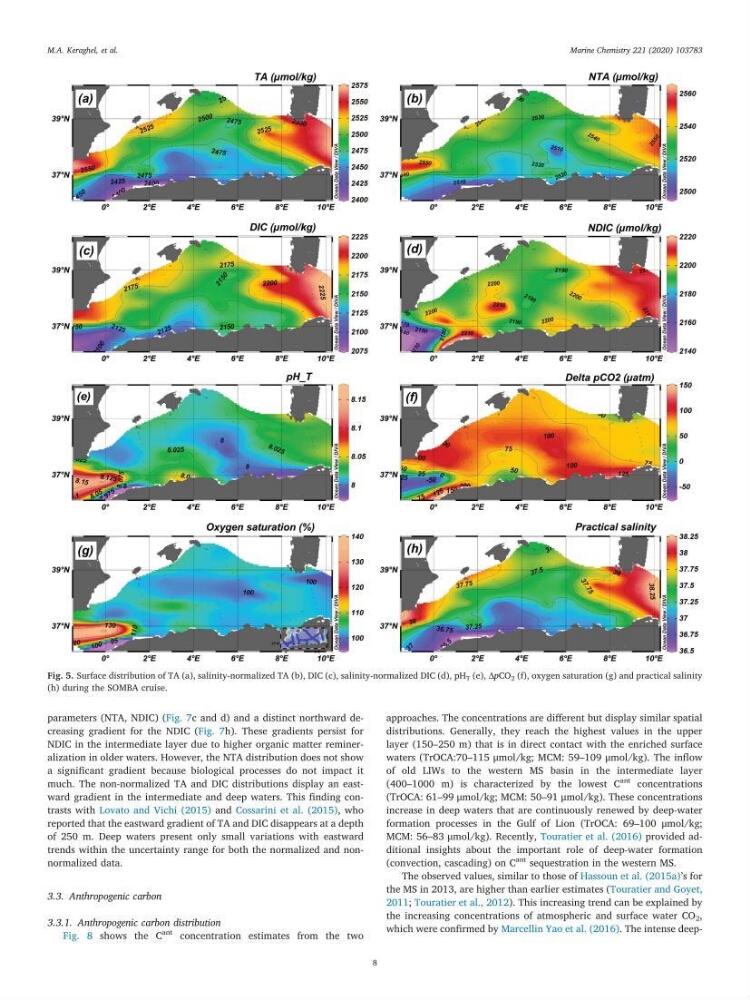
which were confirmed by Marcellin Yao et al. (2016). The intense deepFig. 5. Surface distribution of TA (a), salinity-normalized TA (b), DIC (c), salinity-normalized DIC (d), pH T (e), ΔpCO 2 (f), oxygen saturation (g) and practical salinity
(h) during the SOMBA cruise.
M.A. Keraghel, et al.
Marine Chemistry 221 (2020) 103783
8
NDIC in the intermediate layer due to higher organic matter remineralization in older waters. However, the NTA distribution does not show
a significant gradient because biological processes do not impact it
much. The non-normalized TA and DIC distributions display an eastward gradient in the intermediate and deep waters. This finding contrasts with Lovato and Vichi (2015) and Cossarini et al. (2015), who
reported that the eastward gradient of TA and DIC disappears at a depth
of 250 m. Deep waters present only small variations with eastward
trends within the uncertainty range for both the normalized and nonnormalized data.
3.3. Anthropogenic carbon
3.3.1. Anthropogenic carbon distribution
Fig. 8 shows the C
ant
concentration estimates from the two
approaches. The concentrations are different but display similar spatial
distributions. Generally, they reach the highest values in the upper
layer (150–250 m) that is in direct contact with the enriched surface
waters (TrOCA:70–115 μmol/kg; MCM: 59–109 μmol/kg). The inflow
of old LIWs to the western MS basin in the intermediate layer
(400–1000 m) is characterized by the lowest C
ant
concentrations
(TrOCA: 61–99 μmol/kg; MCM: 50–91 μmol/kg). These concentrations
increase in deep waters that are continuously renewed by deep-water
formation processes in the Gulf of Lion (TrOCA: 69–100 μmol/kg;
MCM: 56–83 μmol/kg). Recently, Touratier et al. (2016) provided additional insights about the important role of deep-water formation
(convection, cascading) on C
ant
sequestration in the western MS.
The observed values, similar to those of Hassoun et al. (2015a)’s for
the MS in 2013, are higher than earlier estimates (Touratier and Goyet,
2011; Touratier et al., 2012). This increasing trend can be explained by
the increasing concentrations of atmospheric and surface water CO 2 ,
which were confirmed by Marcellin Yao et al. (2016). The intense deepFig. 5. Surface distribution of TA (a), salinity-normalized TA (b), DIC (c), salinity-normalized DIC (d), pH T (e), ΔpCO 2 (f), oxygen saturation (g) and practical salinity
(h) during the SOMBA cruise.
M.A. Keraghel, et al.
Marine Chemistry 221 (2020) 103783
8