

observations (e.g., Béthoux et al., 2002; Schroeder et al., 2010). The
bottom of the basin is almost entirely covered by more oxygenated,
newly formed WMDWs (WMDWn, Fig. 3c), characterized by slightly
higher salinities and temperatures (38.49 and 12.91 °C, respectively)
than the usual WMDWs. These waters are probably the result of the
Western Mediterranean Transient (WMT) described by Schroeder et al.
(2008).
3.2.2. Surface waters (0–150 m)
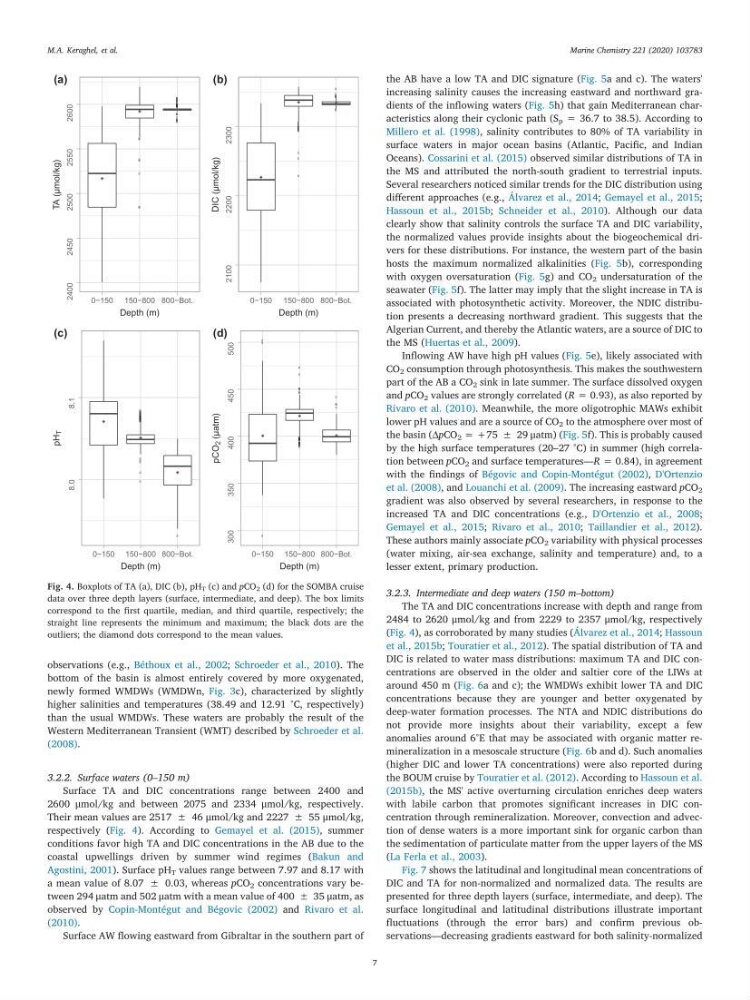
Surface TA and DIC concentrations range between 2400 and
2600 μmol/kg and between 2075 and 2334 μmol/kg, respectively.
Their mean values are 2517 ± 46 μmol/kg and 2227 ± 55 μmol/kg,
respectively (Fig. 4). According to Gemayel et al. (2015), summer
conditions favor high TA and DIC concentrations in the AB due to the
coastal upwellings driven by summer wind regimes (Bakun and
Agostini, 2001). Surface pH T values range between 7.97 and 8.17 with
a mean value of 8.07 ± 0.03, whereas pCO 2 concentrations vary between 294 μatm and 502 μatm with a mean value of 400 ± 35 μatm, as
observed by Copin-Montégut and Bégovic (2002) and Rivaro et al.
(2010).
Surface AW flowing eastward from Gibraltar in the southern part of
the AB have a low TA and DIC signature (Fig. 5a and c). The waters'
increasing salinity causes the increasing eastward and northward gradients of the inflowing waters (Fig. 5h) that gain Mediterranean characteristics along their cyclonic path (S p = 36.7 to 38.5). According to
Millero et al. (1998), salinity contributes to 80% of TA variability in
surface waters in major ocean basins (Atlantic, Pacific, and Indian
Oceans). Cossarini et al. (2015) observed similar distributions of TA in
the MS and attributed the north-south gradient to terrestrial inputs.
Several researchers noticed similar trends for the DIC distribution using
different approaches (e.g., Álvarez et al., 2014; Gemayel et al., 2015;
Hassoun et al., 2015b; Schneider et al., 2010). Although our data
clearly show that salinity controls the surface TA and DIC variability,
the normalized values provide insights about the biogeochemical drivers for these distributions. For instance, the western part of the basin
hosts the maximum normalized alkalinities (Fig. 5b), corresponding
with oxygen oversaturation (Fig. 5g) and CO 2 undersaturation of the
seawater (Fig. 5f). The latter may imply that the slight increase in TA is
associated with photosynthetic activity. Moreover, the NDIC distribution presents a decreasing northward gradient. This suggests that the
Algerian Current, and thereby the Atlantic waters, are a source of DIC to
the MS (Huertas et al., 2009).
Inflowing AW have high pH values (Fig. 5e), likely associated with
CO 2 consumption through photosynthesis. This makes the southwestern
part of the AB a CO 2 sink in late summer. The surface dissolved oxygen
and pCO 2 values are strongly correlated (R = 0.93), as also reported by
Rivaro et al. (2010). Meanwhile, the more oligotrophic MAWs exhibit
lower pH values and are a source of CO 2 to the atmosphere over most of
the basin (ΔpCO 2 = +75 ± 29 μatm) (Fig. 5f). This is probably caused
by the high surface temperatures (20–27 °C) in summer (high correlation between pCO 2 and surface temperatures—R = 0.84), in agreement
with the findings of Bégovic and Copin-Montégut (2002), D'Ortenzio
et al. (2008), and Louanchi et al. (2009). The increasing eastward pCO 2
gradient was also observed by several researchers, in response to the
increased TA and DIC concentrations (e.g., D'Ortenzio et al., 2008;
Gemayel et al., 2015; Rivaro et al., 2010; Taillandier et al., 2012).
These authors mainly associate pCO 2 variability with physical processes
(water mixing, air-sea exchange, salinity and temperature) and, to a
lesser extent, primary production.
3.2.3. Intermediate and deep waters (150 m–bottom)
The TA and DIC concentrations increase with depth and range from
2484 to 2620 μmol/kg and from 2229 to 2357 μmol/kg, respectively
(Fig. 4), as corroborated by many studies (Álvarez et al., 2014; Hassoun
et al., 2015b; Touratier et al., 2012). The spatial distribution of TA and
DIC is related to water mass distributions: maximum TA and DIC concentrations are observed in the older and saltier core of the LIWs at
around 450 m (Fig. 6a and c); the WMDWs exhibit lower TA and DIC
concentrations because they are younger and better oxygenated by
deep-water formation processes. The NTA and NDIC distributions do
not provide more insights about their variability, except a few
anomalies around 6°E that may be associated with organic matter remineralization in a mesoscale structure (Fig. 6b and d). Such anomalies
(higher DIC and lower TA concentrations) were also reported during
the BOUM cruise by Touratier et al. (2012). According to Hassoun et al.
(2015b), the MS' active overturning circulation enriches deep waters
with labile carbon that promotes significant increases in DIC concentration through remineralization. Moreover, convection and advection of dense waters is a more important sink for organic carbon than
the sedimentation of particulate matter from the upper layers of the MS
(La Ferla et al., 2003).
Fig. 7 shows the latitudinal and longitudinal mean concentrations of
DIC and TA for non-normalized and normalized data. The results are
presented for three depth layers (surface, intermediate, and deep). The
surface longitudinal and latitudinal distributions illustrate important
fluctuations (through the error bars) and confirm previous observations—decreasing gradients eastward for both salinity-normalized
2400
2450
2500
2550
2600
0−150 150−800 800−Bot.
Depth (m)
TA (µmol/kg)
(a)
2100
2200
2300
0−150 150−800 800−Bot.
Depth (m)
DIC (µmol/kg)
(b)
8.0
8.1
0−150 150−800 800−Bot.
Depth (m)
pH
T
(c)
300
350
400
450
500
0−150 150−800 800−Bot.
Depth (m)
pCO
2 (µatm)
(d)
Fig. 4. Boxplots of TA (a), DIC (b), pH T (c) and pCO 2 (d) for the SOMBA cruise
data over three depth layers (surface, intermediate, and deep). The box limits
correspond to the first quartile, median, and third quartile, respectively; the
straight line represents the minimum and maximum; the black dots are the
outliers; the diamond dots correspond to the mean values.
M.A. Keraghel, et al.
Marine Chemistry 221 (2020) 103783
7
bottom of the basin is almost entirely covered by more oxygenated,
newly formed WMDWs (WMDWn, Fig. 3c), characterized by slightly
higher salinities and temperatures (38.49 and 12.91 °C, respectively)
than the usual WMDWs. These waters are probably the result of the
Western Mediterranean Transient (WMT) described by Schroeder et al.
(2008).
3.2.2. Surface waters (0–150 m)
Surface TA and DIC concentrations range between 2400 and
2600 μmol/kg and between 2075 and 2334 μmol/kg, respectively.
Their mean values are 2517 ± 46 μmol/kg and 2227 ± 55 μmol/kg,
respectively (Fig. 4). According to Gemayel et al. (2015), summer
conditions favor high TA and DIC concentrations in the AB due to the
coastal upwellings driven by summer wind regimes (Bakun and
Agostini, 2001). Surface pH T values range between 7.97 and 8.17 with
a mean value of 8.07 ± 0.03, whereas pCO 2 concentrations vary between 294 μatm and 502 μatm with a mean value of 400 ± 35 μatm, as
observed by Copin-Montégut and Bégovic (2002) and Rivaro et al.
(2010).
Surface AW flowing eastward from Gibraltar in the southern part of
the AB have a low TA and DIC signature (Fig. 5a and c). The waters'
increasing salinity causes the increasing eastward and northward gradients of the inflowing waters (Fig. 5h) that gain Mediterranean characteristics along their cyclonic path (S p = 36.7 to 38.5). According to
Millero et al. (1998), salinity contributes to 80% of TA variability in
surface waters in major ocean basins (Atlantic, Pacific, and Indian
Oceans). Cossarini et al. (2015) observed similar distributions of TA in
the MS and attributed the north-south gradient to terrestrial inputs.
Several researchers noticed similar trends for the DIC distribution using
different approaches (e.g., Álvarez et al., 2014; Gemayel et al., 2015;
Hassoun et al., 2015b; Schneider et al., 2010). Although our data
clearly show that salinity controls the surface TA and DIC variability,
the normalized values provide insights about the biogeochemical drivers for these distributions. For instance, the western part of the basin
hosts the maximum normalized alkalinities (Fig. 5b), corresponding
with oxygen oversaturation (Fig. 5g) and CO 2 undersaturation of the
seawater (Fig. 5f). The latter may imply that the slight increase in TA is
associated with photosynthetic activity. Moreover, the NDIC distribution presents a decreasing northward gradient. This suggests that the
Algerian Current, and thereby the Atlantic waters, are a source of DIC to
the MS (Huertas et al., 2009).
Inflowing AW have high pH values (Fig. 5e), likely associated with
CO 2 consumption through photosynthesis. This makes the southwestern
part of the AB a CO 2 sink in late summer. The surface dissolved oxygen
and pCO 2 values are strongly correlated (R = 0.93), as also reported by
Rivaro et al. (2010). Meanwhile, the more oligotrophic MAWs exhibit
lower pH values and are a source of CO 2 to the atmosphere over most of
the basin (ΔpCO 2 = +75 ± 29 μatm) (Fig. 5f). This is probably caused
by the high surface temperatures (20–27 °C) in summer (high correlation between pCO 2 and surface temperatures—R = 0.84), in agreement
with the findings of Bégovic and Copin-Montégut (2002), D'Ortenzio
et al. (2008), and Louanchi et al. (2009). The increasing eastward pCO 2
gradient was also observed by several researchers, in response to the
increased TA and DIC concentrations (e.g., D'Ortenzio et al., 2008;
Gemayel et al., 2015; Rivaro et al., 2010; Taillandier et al., 2012).
These authors mainly associate pCO 2 variability with physical processes
(water mixing, air-sea exchange, salinity and temperature) and, to a
lesser extent, primary production.
3.2.3. Intermediate and deep waters (150 m–bottom)
The TA and DIC concentrations increase with depth and range from
2484 to 2620 μmol/kg and from 2229 to 2357 μmol/kg, respectively
(Fig. 4), as corroborated by many studies (Álvarez et al., 2014; Hassoun
et al., 2015b; Touratier et al., 2012). The spatial distribution of TA and
DIC is related to water mass distributions: maximum TA and DIC concentrations are observed in the older and saltier core of the LIWs at
around 450 m (Fig. 6a and c); the WMDWs exhibit lower TA and DIC
concentrations because they are younger and better oxygenated by
deep-water formation processes. The NTA and NDIC distributions do
not provide more insights about their variability, except a few
anomalies around 6°E that may be associated with organic matter remineralization in a mesoscale structure (Fig. 6b and d). Such anomalies
(higher DIC and lower TA concentrations) were also reported during
the BOUM cruise by Touratier et al. (2012). According to Hassoun et al.
(2015b), the MS' active overturning circulation enriches deep waters
with labile carbon that promotes significant increases in DIC concentration through remineralization. Moreover, convection and advection of dense waters is a more important sink for organic carbon than
the sedimentation of particulate matter from the upper layers of the MS
(La Ferla et al., 2003).
Fig. 7 shows the latitudinal and longitudinal mean concentrations of
DIC and TA for non-normalized and normalized data. The results are
presented for three depth layers (surface, intermediate, and deep). The
surface longitudinal and latitudinal distributions illustrate important
fluctuations (through the error bars) and confirm previous observations—decreasing gradients eastward for both salinity-normalized
2400
2450
2500
2550
2600
0−150 150−800 800−Bot.
Depth (m)
TA (µmol/kg)
(a)
2100
2200
2300
0−150 150−800 800−Bot.
Depth (m)
DIC (µmol/kg)
(b)
8.0
8.1
0−150 150−800 800−Bot.
Depth (m)
pH
T
(c)
300
350
400
450
500
0−150 150−800 800−Bot.
Depth (m)
pCO
2 (µatm)
(d)
Fig. 4. Boxplots of TA (a), DIC (b), pH T (c) and pCO 2 (d) for the SOMBA cruise
data over three depth layers (surface, intermediate, and deep). The box limits
correspond to the first quartile, median, and third quartile, respectively; the
straight line represents the minimum and maximum; the black dots are the
outliers; the diamond dots correspond to the mean values.
M.A. Keraghel, et al.
Marine Chemistry 221 (2020) 103783
7