

the errors in the selected parametrization used to calculate C
ant
concentrations (systematic errors). We conducted four sets of tests:
• The preformed alkalinity was calculated using two equations:
Hassoun et al. (2015b)’s equation for the Liguro-Provencal surface
waters (0–25 m) derived from the MEDSEA cruise (TA
0
= 100.72
S p − 1282.6) and Copin-Montégut and Bégovic (2002)’s equation
for surface waters at the DYFAMED site (TA
0
= 93.996
S p − 1038.1).
• We used another set of stoichiometric ratios (Körtzinger et al., 2001)
corresponding to the revised Redfield ratios with a corrected carbon
coefficient for the anthropogenic CO 2 (C:N:P:O 2 = 123:17.5:1:−165).
• A 2% undersaturation of seawater was tested instead of 4% for the
preformed oxygen concentrations, considering that the oxygen solubility pump may enhance oxygen concentrations in cold surface
waters.
• Taillandier et al. (2012) showed that the winter air-sea ΔpCO 2 is
decreasing (pCO 2
atm
is rising faster than that of the ocean). Thus, we
tested an undersaturation of −20 μatm (pCO 2 = 260 μatm) for the
preindustrial situation.
The random error associated with the estimated C
ant
concentrations was
computed through error propagation using the formula described in Gruber
et al. (1996), assuming that the errors were independent of each other
( =
=
=
=
1.6 µmol/kg,
4.9 µmol/kg,
2 µmol/kg,
7.5 µmol/kg,
O2
O 2
0
TA
TA 0
DIC
=
=
=
=
3.3 µmol/kg,
3 µmol/kg,
0.0816,
0.0097
C
0,PI
C
O2
N
O2
) (Table 2).
The RMSD values between the selected and tested parametrizations for the
four parameters are reported in Table 3(1). The total error in C
ant
concentrations was 8.3 μmol/kg with a maximum error of about 12.6 μmol/kg
(considering the values of σ C 0, PI and σ TA 0 from Table 3(1)). Subsequently, the
retained uncertainty is ± 10 μmol/kg. This is 9.2% of the computed C
ant
values. Table 3(2) shows that stoichiometric parametrization causes the
lowest error on the calculation of C
ant
concentrations (2.2 μmol/kg). Preformed oxygen and TA parametrizations generate an uncertainty of the
same order of magnitude (3 μmol/kg), whereas the estimate of C
0,PI
introduces an error of up to 9.4 μmol/kg. Nevertheless, the sensitivity tests'
results illustrate that systematic errors in estimating C
ant
concentrations
through the MCM approach are acceptable and lie within the estimated
random error of 10 μmol/kg.
3.1.2. The TrOCA approach
The TrOCA is a semi-conservative-tracer model developed by
Touratier and Goyet (2004). The model was later improved to better
estimate the preindustrial term TrOCA
0
(Touratier et al., 2007), and
used by the authors, in combination with three tracers (⊿
14
C, CFC-11,
and
3
H), to identify old oceanic water masses that are unaffected by the
anthropogenic carbon invasion in the global ocean. The TrOCA
0
was
computed as a function of two measurable parameters (TA and θ). This
approach assumes constant stoichiometric ratios, TA, and oxygen concentrations (O 2 ). The anthropogenic carbon concentration is calculated
using the following equation:
=
+
×
×
C
O
DIC
TA
exp
1. 279
1.279
Ant
TrOCA
TA
2
1
2
7.511 (1.087 10 2 )
7.81 10 5
2
(12)
The estimated uncertainty for this method is ± 9.8 μmol/kg (8.5%
of the C
ant
maximum value), using the error propagation equation described by Touratier et al. (2007).
3.1.3. Acidification assessment
The change in the AB's pH from the preindustrial period to 2014
(ΔpH) was calculated using the following equation:
=
pH
pH
pH preind
2014
(13)
where pH 2014 is the computed total pH described in section (1.3);
pH preind is the pH T of preindustrial era calculated using the preindustrial TA (assuming that TA remains constant over time) and the
preindustrial DIC (DIC preind ). The latter was estimated by subtracting
the computed anthropogenic fraction from the measured DIC:
=
DIC
DIC
C
preind
ant
(14)
3.2. The distribution of carbonate system properties
3.2.1. Physical settings
A hydrological study was conducted before studying the distribution
of the carbonate system parameters. It used θ/S p diagrams and the
vertical distribution of practical salinity (Fig. 3). Consequently, the
basin was separated into three layers. First, the surface layer (0–150 m),
characterized by Atlantic Waters (AW) that penetrate the AB from the
Almeria-Oran front, with an Atlantic salinity signature of 36.7. Fig. 1
reveals active mesoscale activity during the SOMBA cruise, characterized by a significant anticyclonic eddy with a Sea Level Anomaly (SLA)
of about 0.35 m centered in the eastern part of the basin at 38.2°N/
5.8°E. The Algerian Current shows these baroclinic instabilities
throughout its eastward progression (Millot and Taupier-Letage, 2005).
Second, the intermediate layer (150–800 m), mainly marked by the
Levantine Intermediate Waters (LIWs) that penetrate the AB through
the Sardinian Channel, with temperatures between 13.6 °C and 14.17 °C
and salinities between 38.5 and 38.75. The LIWs are characterized by
their minimum oxygen concentrations (165–170 μmol/kg) and high
salinities. They flow northward along the western Sardinian coasts to
begin their cyclonic path in the western MS, as described in Millot and
Taupier-Letage (2005). Fig. 3(b and d) illustrate the separation between
the intermediate waters of the eastern (~4°E–10°E) and the western
(~1°W–4°E) parts of the basin, a separation that seems to be related to
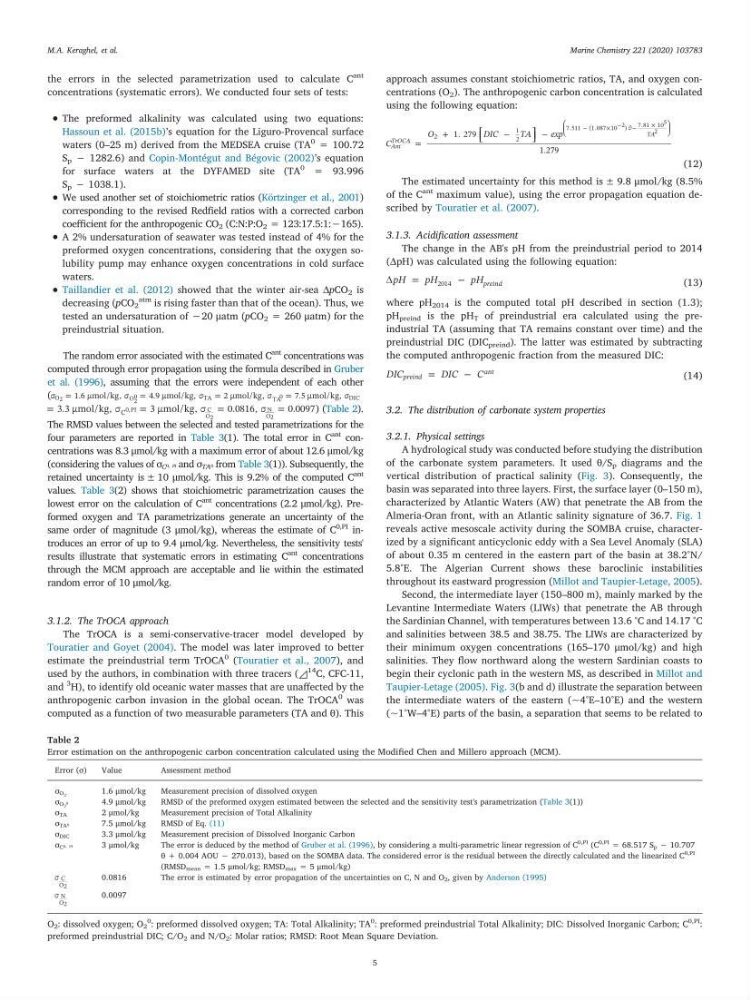
Table 2
Error estimation on the anthropogenic carbon concentration calculated using the Modified Chen and Millero approach (MCM).
Error (σ)
Value
Assessment method
σ O 2
1.6 μmol/kg
Measurement precision of dissolved oxygen
σ O 2
0
4.9 μmol/kg
RMSD of the preformed oxygen estimated between the selected and the sensitivity test's parametrization (Table 3(1))
σ TA
2 μmol/kg
Measurement precision of Total Alkalinity
σ TA 0
7.5 μmol/kg
RMSD of Eq. (11)
σ DIC
3.3 μmol/kg
Measurement precision of Dissolved Inorganic Carbon
σ C 0, PI
3 μmol/kg
The error is deduced by the method of Gruber et al. (1996), by considering a multi-parametric linear regression of C
0,PI (C
0,PI = 68.517 S p − 10.707
θ + 0.004 AOU − 270.013), based on the SOMBA data. The considered error is the residual between the directly calculated and the linearized C
0,PI
(RMSD mean = 1.5 μmol/kg; RMSD max = 5 μmol/kg)
C
O2
0.0816
The error is estimated by error propagation of the uncertainties on C, N and O 2 , given by Anderson (1995)
N
O2
0.0097
O 2 : dissolved oxygen; O 2
0
: preformed dissolved oxygen; TA: Total Alkalinity; TA
0
: preformed preindustrial Total Alkalinity; DIC: Dissolved Inorganic Carbon; C
0,PI
:
preformed preindustrial DIC; C/O 2 and N/O 2 : Molar ratios; RMSD: Root Mean Square Deviation.
M.A. Keraghel, et al.
Marine Chemistry 221 (2020) 103783
5
ant
concentrations (systematic errors). We conducted four sets of tests:
• The preformed alkalinity was calculated using two equations:
Hassoun et al. (2015b)’s equation for the Liguro-Provencal surface
waters (0–25 m) derived from the MEDSEA cruise (TA
0
= 100.72
S p − 1282.6) and Copin-Montégut and Bégovic (2002)’s equation
for surface waters at the DYFAMED site (TA
0
= 93.996
S p − 1038.1).
• We used another set of stoichiometric ratios (Körtzinger et al., 2001)
corresponding to the revised Redfield ratios with a corrected carbon
coefficient for the anthropogenic CO 2 (C:N:P:O 2 = 123:17.5:1:−165).
• A 2% undersaturation of seawater was tested instead of 4% for the
preformed oxygen concentrations, considering that the oxygen solubility pump may enhance oxygen concentrations in cold surface
waters.
• Taillandier et al. (2012) showed that the winter air-sea ΔpCO 2 is
decreasing (pCO 2
atm
is rising faster than that of the ocean). Thus, we
tested an undersaturation of −20 μatm (pCO 2 = 260 μatm) for the
preindustrial situation.
The random error associated with the estimated C
ant
concentrations was
computed through error propagation using the formula described in Gruber
et al. (1996), assuming that the errors were independent of each other
( =
=
=
=
1.6 µmol/kg,
4.9 µmol/kg,
2 µmol/kg,
7.5 µmol/kg,
O2
O 2
0
TA
TA 0
DIC
=
=
=
=
3.3 µmol/kg,
3 µmol/kg,
0.0816,
0.0097
C
0,PI
C
O2
N
O2
) (Table 2).
The RMSD values between the selected and tested parametrizations for the
four parameters are reported in Table 3(1). The total error in C
ant
concentrations was 8.3 μmol/kg with a maximum error of about 12.6 μmol/kg
(considering the values of σ C 0, PI and σ TA 0 from Table 3(1)). Subsequently, the
retained uncertainty is ± 10 μmol/kg. This is 9.2% of the computed C
ant
values. Table 3(2) shows that stoichiometric parametrization causes the
lowest error on the calculation of C
ant
concentrations (2.2 μmol/kg). Preformed oxygen and TA parametrizations generate an uncertainty of the
same order of magnitude (3 μmol/kg), whereas the estimate of C
0,PI
introduces an error of up to 9.4 μmol/kg. Nevertheless, the sensitivity tests'
results illustrate that systematic errors in estimating C
ant
concentrations
through the MCM approach are acceptable and lie within the estimated
random error of 10 μmol/kg.
3.1.2. The TrOCA approach
The TrOCA is a semi-conservative-tracer model developed by
Touratier and Goyet (2004). The model was later improved to better
estimate the preindustrial term TrOCA
0
(Touratier et al., 2007), and
used by the authors, in combination with three tracers (⊿
14
C, CFC-11,
and
3
H), to identify old oceanic water masses that are unaffected by the
anthropogenic carbon invasion in the global ocean. The TrOCA
0
was
computed as a function of two measurable parameters (TA and θ). This
approach assumes constant stoichiometric ratios, TA, and oxygen concentrations (O 2 ). The anthropogenic carbon concentration is calculated
using the following equation:
=
+
×
×
C
O
DIC
TA
exp
1. 279
1.279
Ant
TrOCA
TA
2
1
2
7.511 (1.087 10 2 )
7.81 10 5
2
(12)
The estimated uncertainty for this method is ± 9.8 μmol/kg (8.5%
of the C
ant
maximum value), using the error propagation equation described by Touratier et al. (2007).
3.1.3. Acidification assessment
The change in the AB's pH from the preindustrial period to 2014
(ΔpH) was calculated using the following equation:
=
pH
pH
pH preind
2014
(13)
where pH 2014 is the computed total pH described in section (1.3);
pH preind is the pH T of preindustrial era calculated using the preindustrial TA (assuming that TA remains constant over time) and the
preindustrial DIC (DIC preind ). The latter was estimated by subtracting
the computed anthropogenic fraction from the measured DIC:
=
DIC
DIC
C
preind
ant
(14)
3.2. The distribution of carbonate system properties
3.2.1. Physical settings
A hydrological study was conducted before studying the distribution
of the carbonate system parameters. It used θ/S p diagrams and the
vertical distribution of practical salinity (Fig. 3). Consequently, the
basin was separated into three layers. First, the surface layer (0–150 m),
characterized by Atlantic Waters (AW) that penetrate the AB from the
Almeria-Oran front, with an Atlantic salinity signature of 36.7. Fig. 1
reveals active mesoscale activity during the SOMBA cruise, characterized by a significant anticyclonic eddy with a Sea Level Anomaly (SLA)
of about 0.35 m centered in the eastern part of the basin at 38.2°N/
5.8°E. The Algerian Current shows these baroclinic instabilities
throughout its eastward progression (Millot and Taupier-Letage, 2005).
Second, the intermediate layer (150–800 m), mainly marked by the
Levantine Intermediate Waters (LIWs) that penetrate the AB through
the Sardinian Channel, with temperatures between 13.6 °C and 14.17 °C
and salinities between 38.5 and 38.75. The LIWs are characterized by
their minimum oxygen concentrations (165–170 μmol/kg) and high
salinities. They flow northward along the western Sardinian coasts to
begin their cyclonic path in the western MS, as described in Millot and
Taupier-Letage (2005). Fig. 3(b and d) illustrate the separation between
the intermediate waters of the eastern (~4°E–10°E) and the western
(~1°W–4°E) parts of the basin, a separation that seems to be related to
Table 2
Error estimation on the anthropogenic carbon concentration calculated using the Modified Chen and Millero approach (MCM).
Error (σ)
Value
Assessment method
σ O 2
1.6 μmol/kg
Measurement precision of dissolved oxygen
σ O 2
0
4.9 μmol/kg
RMSD of the preformed oxygen estimated between the selected and the sensitivity test's parametrization (Table 3(1))
σ TA
2 μmol/kg
Measurement precision of Total Alkalinity
σ TA 0
7.5 μmol/kg
RMSD of Eq. (11)
σ DIC
3.3 μmol/kg
Measurement precision of Dissolved Inorganic Carbon
σ C 0, PI
3 μmol/kg
The error is deduced by the method of Gruber et al. (1996), by considering a multi-parametric linear regression of C
0,PI (C
0,PI = 68.517 S p − 10.707
θ + 0.004 AOU − 270.013), based on the SOMBA data. The considered error is the residual between the directly calculated and the linearized C
0,PI
(RMSD mean = 1.5 μmol/kg; RMSD max = 5 μmol/kg)
C
O2
0.0816
The error is estimated by error propagation of the uncertainties on C, N and O 2 , given by Anderson (1995)
N
O2
0.0097
O 2 : dissolved oxygen; O 2
0
: preformed dissolved oxygen; TA: Total Alkalinity; TA
0
: preformed preindustrial Total Alkalinity; DIC: Dissolved Inorganic Carbon; C
0,PI
:
preformed preindustrial DIC; C/O 2 and N/O 2 : Molar ratios; RMSD: Root Mean Square Deviation.
M.A. Keraghel, et al.
Marine Chemistry 221 (2020) 103783
5