

calculated according to Weiss and Price (1980)’s equation, assuming
that the air above the air-sea interface is water saturated.
2.4. Anthropogenic carbon inventory
The AB was divided into a grid of eleven boxes of 2° longitude by 2°
latitude each to compute the inventory of its sequestered C
ant
. A vertical
profile of C
ant
concentrations for each box was calculated by averaging
the data from layers of varying thicknesses, ranging from 150 m to the
ocean floor, following the MEDAR/MEDATLAS (Mediterranean Data
Archaeology and Rescue) vertical grid standard (Eq. (7)). The sum of all
the boxes represents the total C
ant
inventory of the AB. The associated
uncertainty was assessed by an error propagation equation.
=
×
×
×
×
=
C
g C
C
dz
z
Vol
(
)
(
)
12 /(
150)
box inv
ant
i
m
bottom
i
ant
i
i
bottom
box
150
(7)
where C box−inv
ant
is the anthropogenic carbon inventory for each box in
grams of carbon (g C); C i
ant
is the computed anthropogenic carbon
concentration (mol/kg); dz i is the corresponding thickness of the layer
(m); ρ i is water density expressed in kg/m
3
; 12 is the atomic mass of
carbon (g/mol); Z bottom is the bottom depth of the profile (m); Vol box is
the computed volume of the box (m
3
), based on the AB bathymetry
provided by the General Bathymetric Chart of the Oceans (GEBCO,
2019).
3. Results and discussion
3.1. Anthropogenic carbon and acidification assessment
In this study, we calculated the C
ant
concentration using two different approaches. First, the back-calculation technique proposed by
Chen and Millero (1979). Second, the TrOCA method proposed by
Touratier et al. (2007). The methods were selected for their simplicity,
data availibility, and adaptability to the characteristics of the MS. They
were not applied to the mixed surface layer (0–150 m) because of its
physical and chemical variability (air-sea exchanges and biological
processes).
3.1.1. The Modified Chen and Millero (1979) approach (MCM)
The measured DIC includes a natural (preformed, preindustrial
carbon, C
0, PI
) and an anthropogenic fraction (C
ant
), in addition to the
in-situ DIC generated (or consumed) by biological processes (C
bio
).
Consequently, anthropogenic carbon concentration is calculated as:
=
C
DIC
C
C
ant
bio
PI
0,
(8)
with:
=
+
C
TA
C O
N O
O
0.5
( /
0.5 / ) .
bio
2
2
2
(9)
=
=
=
TA
TA
TA
O
O
O
AOU
and
mes
0
2
2
0
2
(10)
where TA and TA
0
correspond to the measured and preformed alkalinity, respectively. TA
0
is calculated by applying Eq. (11), derived from
the SOMBA surface data (0–150 m).
=
±
TA
93.779 S
0.57
1004.765 ( 7.5 µmol/kg)
p
0
(11)
C/O 2 and N/O 2 are the molar ratios proposed by Anderson (1995)
based on the average composition of planktonic organic matter (C:N:P:O 2 = 106:16:1:−150); O 2
mes
and O 2
0
are the measured and preformed
dissolved oxygen concentrations, respectively; ∆O 2 can be equated to
AOU. The preformed oxygen concentration is usually assumed to be
equal to the saturation value with respect to the atmosphere. At the
DYFAMED site, 20 years of observational data reveal that seawater is
undersaturated with respect to oxygen in winter (Copin-Montégut and
Bégovic, 2002; Coppola et al., 2018). Therefore, in this study, the
preformed oxygen is assimilated to a seawater undersaturation of 4%
that corresponds to the winter mean observations in the deep-water
formation area. In the western MS, this area lies in the Gulf of Lion, off
the French coast. Seawater oxygen saturation is calculated using the
equation of Benson and Krause (1984).
3.1.1.1. Preformed, preindustrial carbon parametrization (C
0,PI
). All
water masses in the MS have already been contaminated by C
ant
because of their short water renewal time. The preformed,
preindustrial DIC concentration (C
0,PI
) can be determined by
assuming a preindustrial partial pressure of CO 2 (pCO 2 ) of 280 ppm
and a constant preformed alkalinity (TA
0
) (Eq. (11)). This simplified
parametrization corresponds to the C* of Gruber et al. (1996). This term
also accounts for the air-sea disequilibrium of CO 2 when water masses
were last in contact with the atmosphere. Several studies in the deepwater formation region show that seawater is undersaturated with
respect to CO 2 in winter, with a maximum undersaturation of −80
μatm and a mean value between −30 μatm to −40 μatm, depending on
the investigated time-period. This result is based on the in-situ data at
the DYFAMED site (Copin-Montégut et al., 2004; Hood and Merlivat,
2001) and on regional model outputs (D'Ortenzio et al., 2008;
Taillandier et al., 2012). Thus, computing a preindustrial, preformed
DIC from a 280 ppm pCO 2 systematically underestimates the C
ant
concentration, since it overestimates the C
0,PI
. Therefore, we chose to
compute C
0,PI
by considering a pCO 2 undersaturation of −30 μatm
(water pCO 2 = 250 μatm) during winters for the preindustrial era. We
will use the acronym MCM for the Modified Chen and Millero (1979)
approach.
3.1.1.2. Sensitivity tests and uncertainty estimation. The MCM approach
is based on three main assumptions: 1. biological activity remains
constant over time; 2. the MS is at a steady state; 3. the air-sea winter
disequilibrium in the deep-water formation area has been constant
since the preindustrial period. Sensitivity tests were performed to assess
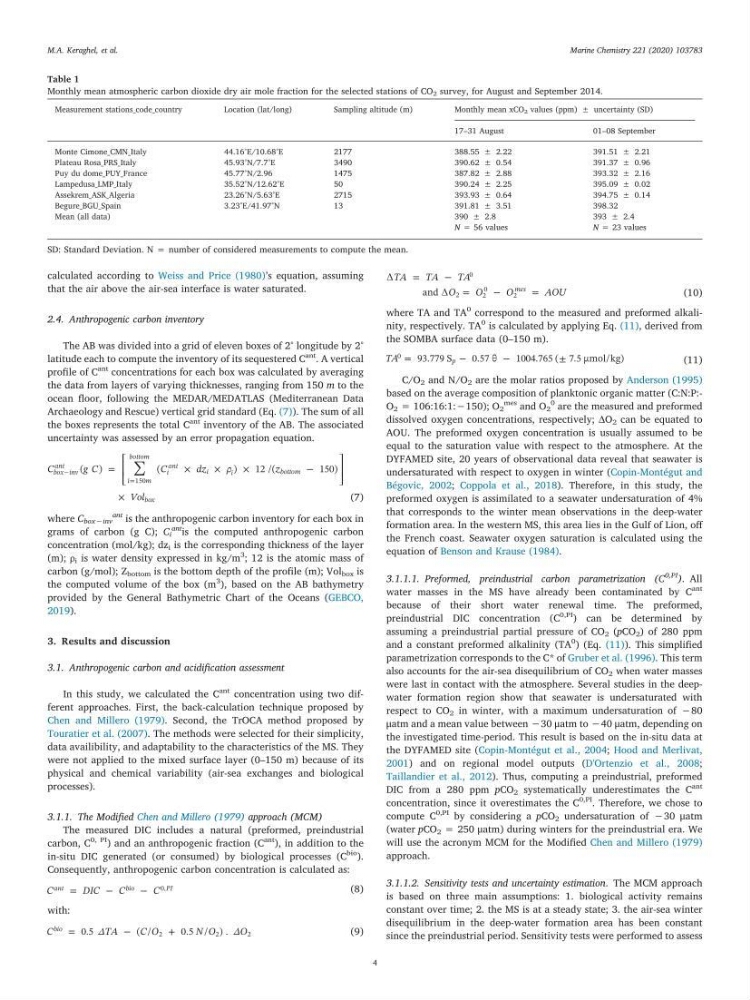
Table 1
Monthly mean atmospheric carbon dioxide dry air mole fraction for the selected stations of CO 2 survey, for August and September 2014.
Measurement stations_code_country
Location (lat/long)
Sampling altitude (m)
Monthly mean xCO 2 values (ppm) ± uncertainty (SD)
17–31 August
01–08 September
Monte Cimone_CMN_Italy
44.16°E/10.68°E
2177
388.55 ± 2.22
391.51 ± 2.21
Plateau Rosa_PRS_Italy
45.93°N/7.7°E
3490
390.62 ± 0.54
391.37 ± 0.96
Puy du dome_PUY_France
45.77°N/2.96
1475
387.82 ± 2.88
393.32 ± 2.16
Lampedusa_LMP_Italy
35.52°N/12.62°E
50
390.24 ± 2.25
395.09 ± 0.02
Assekrem_ASK_Algeria
23.26°N/5.63°E
2715
393.93 ± 0.64
394.75 ± 0.14
Begure_BGU_Spain
3.23°E/41.97°N
13
391.81 ± 3.51
398.32
Mean (all data)
390 ± 2.8
393 ± 2.4
N = 56 values
N = 23 values
SD: Standard Deviation. N = number of considered measurements to compute the mean.
M.A. Keraghel, et al.
Marine Chemistry 221 (2020) 103783
4
that the air above the air-sea interface is water saturated.
2.4. Anthropogenic carbon inventory
The AB was divided into a grid of eleven boxes of 2° longitude by 2°
latitude each to compute the inventory of its sequestered C
ant
. A vertical
profile of C
ant
concentrations for each box was calculated by averaging
the data from layers of varying thicknesses, ranging from 150 m to the
ocean floor, following the MEDAR/MEDATLAS (Mediterranean Data
Archaeology and Rescue) vertical grid standard (Eq. (7)). The sum of all
the boxes represents the total C
ant
inventory of the AB. The associated
uncertainty was assessed by an error propagation equation.
=
×
×
×
×
=
C
g C
C
dz
z
Vol
(
)
(
)
12 /(
150)
box inv
ant
i
m
bottom
i
ant
i
i
bottom
box
150
(7)
where C box−inv
ant
is the anthropogenic carbon inventory for each box in
grams of carbon (g C); C i
ant
is the computed anthropogenic carbon
concentration (mol/kg); dz i is the corresponding thickness of the layer
(m); ρ i is water density expressed in kg/m
3
; 12 is the atomic mass of
carbon (g/mol); Z bottom is the bottom depth of the profile (m); Vol box is
the computed volume of the box (m
3
), based on the AB bathymetry
provided by the General Bathymetric Chart of the Oceans (GEBCO,
2019).
3. Results and discussion
3.1. Anthropogenic carbon and acidification assessment
In this study, we calculated the C
ant
concentration using two different approaches. First, the back-calculation technique proposed by
Chen and Millero (1979). Second, the TrOCA method proposed by
Touratier et al. (2007). The methods were selected for their simplicity,
data availibility, and adaptability to the characteristics of the MS. They
were not applied to the mixed surface layer (0–150 m) because of its
physical and chemical variability (air-sea exchanges and biological
processes).
3.1.1. The Modified Chen and Millero (1979) approach (MCM)
The measured DIC includes a natural (preformed, preindustrial
carbon, C
0, PI
) and an anthropogenic fraction (C
ant
), in addition to the
in-situ DIC generated (or consumed) by biological processes (C
bio
).
Consequently, anthropogenic carbon concentration is calculated as:
=
C
DIC
C
C
ant
bio
PI
0,
(8)
with:
=
+
C
TA
C O
N O
O
0.5
( /
0.5 / ) .
bio
2
2
2
(9)
=
=
=
TA
TA
TA
O
O
O
AOU
and
mes
0
2
2
0
2
(10)
where TA and TA
0
correspond to the measured and preformed alkalinity, respectively. TA
0
is calculated by applying Eq. (11), derived from
the SOMBA surface data (0–150 m).
=
±
TA
93.779 S
0.57
1004.765 ( 7.5 µmol/kg)
p
0
(11)
C/O 2 and N/O 2 are the molar ratios proposed by Anderson (1995)
based on the average composition of planktonic organic matter (C:N:P:O 2 = 106:16:1:−150); O 2
mes
and O 2
0
are the measured and preformed
dissolved oxygen concentrations, respectively; ∆O 2 can be equated to
AOU. The preformed oxygen concentration is usually assumed to be
equal to the saturation value with respect to the atmosphere. At the
DYFAMED site, 20 years of observational data reveal that seawater is
undersaturated with respect to oxygen in winter (Copin-Montégut and
Bégovic, 2002; Coppola et al., 2018). Therefore, in this study, the
preformed oxygen is assimilated to a seawater undersaturation of 4%
that corresponds to the winter mean observations in the deep-water
formation area. In the western MS, this area lies in the Gulf of Lion, off
the French coast. Seawater oxygen saturation is calculated using the
equation of Benson and Krause (1984).
3.1.1.1. Preformed, preindustrial carbon parametrization (C
0,PI
). All
water masses in the MS have already been contaminated by C
ant
because of their short water renewal time. The preformed,
preindustrial DIC concentration (C
0,PI
) can be determined by
assuming a preindustrial partial pressure of CO 2 (pCO 2 ) of 280 ppm
and a constant preformed alkalinity (TA
0
) (Eq. (11)). This simplified
parametrization corresponds to the C* of Gruber et al. (1996). This term
also accounts for the air-sea disequilibrium of CO 2 when water masses
were last in contact with the atmosphere. Several studies in the deepwater formation region show that seawater is undersaturated with
respect to CO 2 in winter, with a maximum undersaturation of −80
μatm and a mean value between −30 μatm to −40 μatm, depending on
the investigated time-period. This result is based on the in-situ data at
the DYFAMED site (Copin-Montégut et al., 2004; Hood and Merlivat,
2001) and on regional model outputs (D'Ortenzio et al., 2008;
Taillandier et al., 2012). Thus, computing a preindustrial, preformed
DIC from a 280 ppm pCO 2 systematically underestimates the C
ant
concentration, since it overestimates the C
0,PI
. Therefore, we chose to
compute C
0,PI
by considering a pCO 2 undersaturation of −30 μatm
(water pCO 2 = 250 μatm) during winters for the preindustrial era. We
will use the acronym MCM for the Modified Chen and Millero (1979)
approach.
3.1.1.2. Sensitivity tests and uncertainty estimation. The MCM approach
is based on three main assumptions: 1. biological activity remains
constant over time; 2. the MS is at a steady state; 3. the air-sea winter
disequilibrium in the deep-water formation area has been constant
since the preindustrial period. Sensitivity tests were performed to assess
Table 1
Monthly mean atmospheric carbon dioxide dry air mole fraction for the selected stations of CO 2 survey, for August and September 2014.
Measurement stations_code_country
Location (lat/long)
Sampling altitude (m)
Monthly mean xCO 2 values (ppm) ± uncertainty (SD)
17–31 August
01–08 September
Monte Cimone_CMN_Italy
44.16°E/10.68°E
2177
388.55 ± 2.22
391.51 ± 2.21
Plateau Rosa_PRS_Italy
45.93°N/7.7°E
3490
390.62 ± 0.54
391.37 ± 0.96
Puy du dome_PUY_France
45.77°N/2.96
1475
387.82 ± 2.88
393.32 ± 2.16
Lampedusa_LMP_Italy
35.52°N/12.62°E
50
390.24 ± 2.25
395.09 ± 0.02
Assekrem_ASK_Algeria
23.26°N/5.63°E
2715
393.93 ± 0.64
394.75 ± 0.14
Begure_BGU_Spain
3.23°E/41.97°N
13
391.81 ± 3.51
398.32
Mean (all data)
390 ± 2.8
393 ± 2.4
N = 56 values
N = 23 values
SD: Standard Deviation. N = number of considered measurements to compute the mean.
M.A. Keraghel, et al.
Marine Chemistry 221 (2020) 103783
4