

Water Flow in Soil
0
48
96
144
192
240
288
Time (hrs)
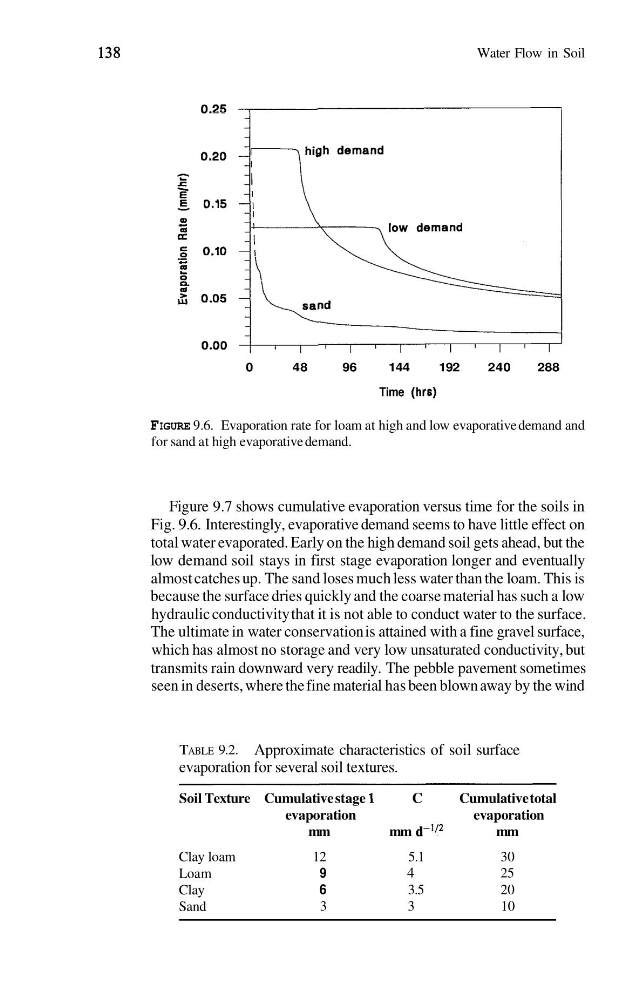
FIGURE 9.6. Evaporation rate for loam at high and low evaporative demand and
for sand at high evaporative demand.
Figure 9.7 shows cumulative evaporation versus time for the soils in
Fig. 9.6. Interestingly, evaporative demand seems to have little effect on
total water evaporated. Early on the high demand soil gets ahead, but the
low demand soil stays in first stage evaporation longer and eventually
almost catches up. The sand loses much less water than the loam. This is
because the surface dries quickly and the coarse material has such a low
hydraulic conductivity that it is not able to conduct water to the surface.
The ultimate in water conservation is attained with a fine gravel surface,
which has almost no storage and very low unsaturated conductivity, but
transmits rain downward very readily. The pebble pavement sometimes
seen in deserts, where the fine material has been blown away by the wind
TABLE 9.2. Approximate characteristics of soil surface
evaporation for several soil textures.
Soil Texture Cumulative stage 1
C
Cumulative total
evaporation
evaporation
mm
mm d-'I2
mm
Clay loam
12
5.1
30
Loam
9
4
25
Clay
6
3.5
20
Sand
3
3
10
0
48
96
144
192
240
288
Time (hrs)
FIGURE 9.6. Evaporation rate for loam at high and low evaporative demand and
for sand at high evaporative demand.
Figure 9.7 shows cumulative evaporation versus time for the soils in
Fig. 9.6. Interestingly, evaporative demand seems to have little effect on
total water evaporated. Early on the high demand soil gets ahead, but the
low demand soil stays in first stage evaporation longer and eventually
almost catches up. The sand loses much less water than the loam. This is
because the surface dries quickly and the coarse material has such a low
hydraulic conductivity that it is not able to conduct water to the surface.
The ultimate in water conservation is attained with a fine gravel surface,
which has almost no storage and very low unsaturated conductivity, but
transmits rain downward very readily. The pebble pavement sometimes
seen in deserts, where the fine material has been blown away by the wind
TABLE 9.2. Approximate characteristics of soil surface
evaporation for several soil textures.
Soil Texture Cumulative stage 1
C
Cumulative total
evaporation
evaporation
mm
mm d-'I2
mm
Clay loam
12
5.1
30
Loam
9
4
25
Clay
6
3.5
20
Sand
3
3
10