

Evaporation from the Soil Surface
137
.1
1
10
100
1000
Time (days)
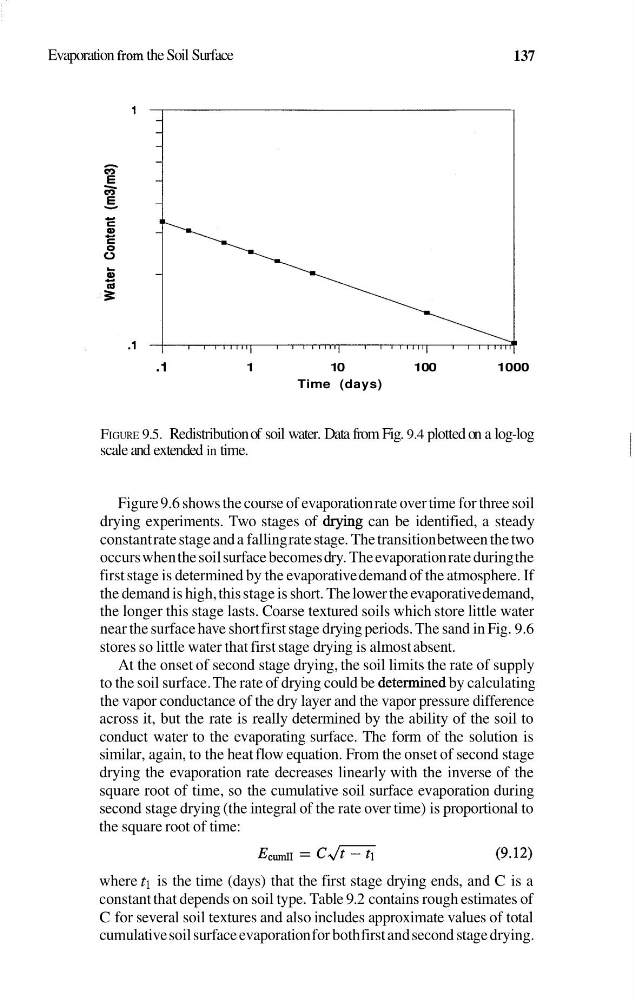
FIGURE 9.5. Redistribution of soil water. Data from Fig. 9.4 plotted on a log-log
scale and extended in time.
Figure 9.6 shows the course of evaporation rate over time for three soil
drying experiments. Two stages of drylug can be identified, a steady
constant rate stage and a falling rate stage. The transition between the two
occurs when the soil surface becomes dry. The evaporation rate during the
first stage is determined by the evaporative demand of the atmosphere. If
the demand is high, this stage is short. The lower the evaporative demand,
the longer this stage lasts. Coarse textured soils which store little water
near the surface have short first stage drying periods. The sand in Fig. 9.6
stores so little water that first stage drying is almost absent.
At the onset of second stage drying, the soil limits the rate of supply
to the soil surface. The rate of drying could be determined by calculating
the vapor conductance of the dry layer and the vapor pressure difference
across it, but the rate is really determined by the ability of the soil to
conduct water to the evaporating surface. The form of the solution is
similar, again, to the heat flow equation. From the onset of second stage
drying the evaporation rate decreases linearly with the inverse of the
square root of time, so the cumulative soil surface evaporation during
second stage drying (the integral of the rate over time) is proportional to
the square root of time:
where tl is the time (days) that the first stage drying ends, and C is a
constant that depends on soil type. Table 9.2 contains rough estimates of
C for several soil textures and also includes approximate values of total
cumulative soil surface evaporation for both first and second stage drying.
137
.1
1
10
100
1000
Time (days)
FIGURE 9.5. Redistribution of soil water. Data from Fig. 9.4 plotted on a log-log
scale and extended in time.
Figure 9.6 shows the course of evaporation rate over time for three soil
drying experiments. Two stages of drylug can be identified, a steady
constant rate stage and a falling rate stage. The transition between the two
occurs when the soil surface becomes dry. The evaporation rate during the
first stage is determined by the evaporative demand of the atmosphere. If
the demand is high, this stage is short. The lower the evaporative demand,
the longer this stage lasts. Coarse textured soils which store little water
near the surface have short first stage drying periods. The sand in Fig. 9.6
stores so little water that first stage drying is almost absent.
At the onset of second stage drying, the soil limits the rate of supply
to the soil surface. The rate of drying could be determined by calculating
the vapor conductance of the dry layer and the vapor pressure difference
across it, but the rate is really determined by the ability of the soil to
conduct water to the evaporating surface. The form of the solution is
similar, again, to the heat flow equation. From the onset of second stage
drying the evaporation rate decreases linearly with the inverse of the
square root of time, so the cumulative soil surface evaporation during
second stage drying (the integral of the rate over time) is proportional to
the square root of time:
where tl is the time (days) that the first stage drying ends, and C is a
constant that depends on soil type. Table 9.2 contains rough estimates of
C for several soil textures and also includes approximate values of total
cumulative soil surface evaporation for both first and second stage drying.