

photocurrent with CAL30. The photo-onset potential was moved negatively and the onset is more energetic in nature. The phenomena
indicate a reduction of the surface recombination for CAL30 material.
The CAL30 was accordingly selected to optimize the photocatalytic
parameters.
3.6.2. Effect of CAL30 content
The removal of TC at different proportions of CAL30 at natural pH
solution and initial TC concentration of 50 mg.L
−1 revealed that the
degradation rate augments with the increase of CAL30 amount in the
range 0.125–1.5 gL
−1 (Fig. 10). However, a decline of efficiency was
observed for 2 g.L
−1 of CAL30 catalyst. The increase in CAL30 doses
induced the increase of both adsorption and photocatalytic sites availabilities [38,39]. With the increase of the catalyst content, suspension
turbidity, light scattering, and also agglomeration of solid particles take
place. The best degradation rate was observed at 1.5 g.L
−1
(k = 2 × 10
−2 min
−1
) of CAL30. As a result, the amount of pollutant
adsorbed by the photocatalyst increases, thus the degradation efficiency
is higher.
However, when CAL30 mass is greater than 1.5 g.L
−1
, the screen
effect becomes important because of the excess of particles that mask
certain parts of the photosensitive surface. As a result, the deep penetration of photons decreases, which consequently decreases the photoactivation of some catalyst particles [40]. Hence, the less photons
penetrate deep in the solution, the less catalyst particles are activated.
Consequently, the production of hydroxyl radicals decline as well as the
degradation efficiency [9].
3.6.3. Effect of TC initial concentration
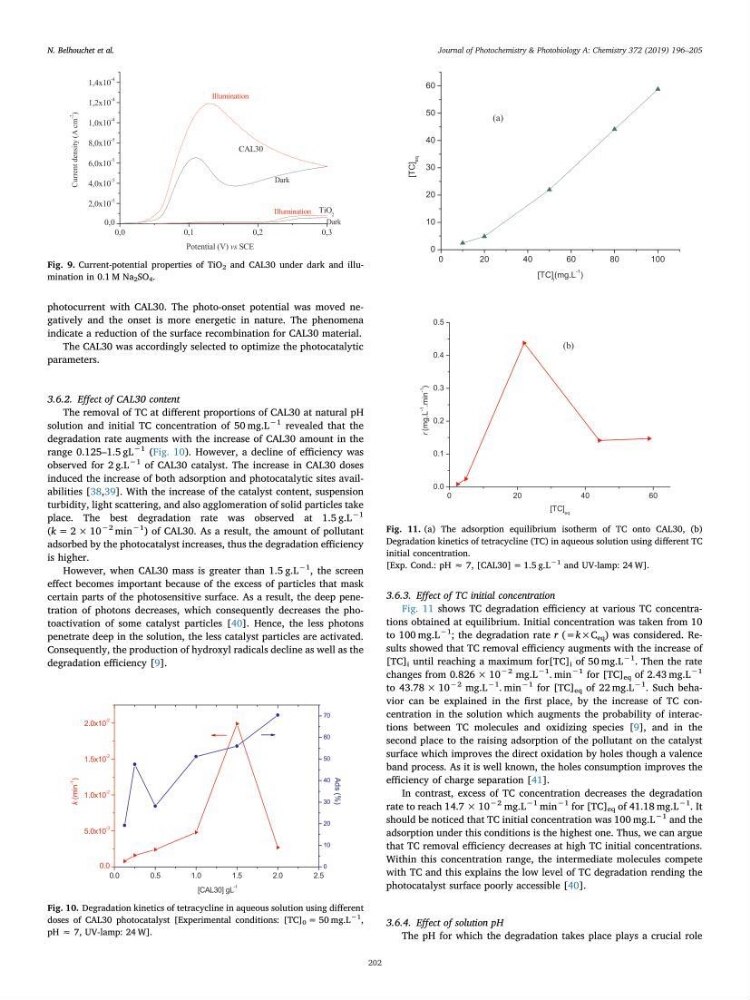
Fig. 11 shows TC degradation efficiency at various TC concentrations obtained at equilibrium. Initial concentration was taken from 10
to 100 mg.L
−1 ; the degradation rate r (=k×C eq ) was considered. Results showed that TC removal efficiency augments with the increase of
[TC] i until reaching a maximum for[TC] i of 50 mg.L
−1
. Then the rate
changes from 0.826 × 10
−2 mg.L
−1 . min
−1 for [TC] eq of 2.43 mg.L
−1
to 43.78 × 10
−2 mg.L
−1
. min
−1 for [TC] eq of 22 mg.L
−1
. Such behavior can be explained in the first place, by the increase of TC concentration in the solution which augments the probability of interactions between TC molecules and oxidizing species [9], and in the
second place to the raising adsorption of the pollutant on the catalyst
surface which improves the direct oxidation by holes though a valence
band process. As it is well known, the holes consumption improves the
efficiency of charge separation [41].
In contrast, excess of TC concentration decreases the degradation
rate to reach 14.7 × 10
−2 mg.L
−1 min
−1 for [TC] eq of 41.18 mg.L
−1 . It
should be noticed that TC initial concentration was 100 mg.L
−1 and the
adsorption under this conditions is the highest one. Thus, we can argue
that TC removal efficiency decreases at high TC initial concentrations.
Within this concentration range, the intermediate molecules compete
with TC and this explains the low level of TC degradation rending the
photocatalyst surface poorly accessible [40].
3.6.4. Effect of solution pH
The pH for which the degradation takes place plays a crucial role
Fig. 9. Current-potential properties of TiO 2 and CAL30 under dark and illumination in 0.1 M Na 2 SO 4 .
Fig. 10. Degradation kinetics of tetracycline in aqueous solution using different
doses of CAL30 photocatalyst [Experimental conditions: [TC] 0 = 50 mg.L
−1
,
pH ≈ 7, UV-lamp: 24 W].
Fig. 11. (a) The adsorption equilibrium isotherm of TC onto CAL30, (b)
Degradation kinetics of tetracycline (TC) in aqueous solution using different TC
initial concentration.
[Exp. Cond.: pH ≈ 7, [CAL30] = 1.5 g.L
−1 and UV-lamp: 24 W].
N. Belhouchet et al.
Journal of Photochemistry & Photobiology A: Chemistry 372 (2019) 196–205
202
indicate a reduction of the surface recombination for CAL30 material.
The CAL30 was accordingly selected to optimize the photocatalytic
parameters.
3.6.2. Effect of CAL30 content
The removal of TC at different proportions of CAL30 at natural pH
solution and initial TC concentration of 50 mg.L
−1 revealed that the
degradation rate augments with the increase of CAL30 amount in the
range 0.125–1.5 gL
−1 (Fig. 10). However, a decline of efficiency was
observed for 2 g.L
−1 of CAL30 catalyst. The increase in CAL30 doses
induced the increase of both adsorption and photocatalytic sites availabilities [38,39]. With the increase of the catalyst content, suspension
turbidity, light scattering, and also agglomeration of solid particles take
place. The best degradation rate was observed at 1.5 g.L
−1
(k = 2 × 10
−2 min
−1
) of CAL30. As a result, the amount of pollutant
adsorbed by the photocatalyst increases, thus the degradation efficiency
is higher.
However, when CAL30 mass is greater than 1.5 g.L
−1
, the screen
effect becomes important because of the excess of particles that mask
certain parts of the photosensitive surface. As a result, the deep penetration of photons decreases, which consequently decreases the photoactivation of some catalyst particles [40]. Hence, the less photons
penetrate deep in the solution, the less catalyst particles are activated.
Consequently, the production of hydroxyl radicals decline as well as the
degradation efficiency [9].
3.6.3. Effect of TC initial concentration
Fig. 11 shows TC degradation efficiency at various TC concentrations obtained at equilibrium. Initial concentration was taken from 10
to 100 mg.L
−1 ; the degradation rate r (=k×C eq ) was considered. Results showed that TC removal efficiency augments with the increase of
[TC] i until reaching a maximum for[TC] i of 50 mg.L
−1
. Then the rate
changes from 0.826 × 10
−2 mg.L
−1 . min
−1 for [TC] eq of 2.43 mg.L
−1
to 43.78 × 10
−2 mg.L
−1
. min
−1 for [TC] eq of 22 mg.L
−1
. Such behavior can be explained in the first place, by the increase of TC concentration in the solution which augments the probability of interactions between TC molecules and oxidizing species [9], and in the
second place to the raising adsorption of the pollutant on the catalyst
surface which improves the direct oxidation by holes though a valence
band process. As it is well known, the holes consumption improves the
efficiency of charge separation [41].
In contrast, excess of TC concentration decreases the degradation
rate to reach 14.7 × 10
−2 mg.L
−1 min
−1 for [TC] eq of 41.18 mg.L
−1 . It
should be noticed that TC initial concentration was 100 mg.L
−1 and the
adsorption under this conditions is the highest one. Thus, we can argue
that TC removal efficiency decreases at high TC initial concentrations.
Within this concentration range, the intermediate molecules compete
with TC and this explains the low level of TC degradation rending the
photocatalyst surface poorly accessible [40].
3.6.4. Effect of solution pH
The pH for which the degradation takes place plays a crucial role
Fig. 9. Current-potential properties of TiO 2 and CAL30 under dark and illumination in 0.1 M Na 2 SO 4 .
Fig. 10. Degradation kinetics of tetracycline in aqueous solution using different
doses of CAL30 photocatalyst [Experimental conditions: [TC] 0 = 50 mg.L
−1
,
pH ≈ 7, UV-lamp: 24 W].
Fig. 11. (a) The adsorption equilibrium isotherm of TC onto CAL30, (b)
Degradation kinetics of tetracycline (TC) in aqueous solution using different TC
initial concentration.
[Exp. Cond.: pH ≈ 7, [CAL30] = 1.5 g.L
−1 and UV-lamp: 24 W].
N. Belhouchet et al.
Journal of Photochemistry & Photobiology A: Chemistry 372 (2019) 196–205
202