

374
P. Meloz‘ti
_________________________________________________________—_____________
Pond
Production
System of
Other fish
area, ha
per
breeding
cultivated
____________________________________________________________________________
6
170,000
monoculture
—
2
90,000
”
*
'
10
65,000
”
-
4
200,000
”
-
4
140,000
”
—
15
70,000
”
.
-
5
160,000
”
—
2
125,000
”
—
6
166,000
”
—
4
75,000
“
—
2
125,000
”
—
6
93,000
”
—
Total, ha
64
X,IL
115,000
”
—
10
35,000
polycu1ture
catfish (Icta1urus melas)
6
32,000
”
catfish
20
40,000
”
catfish, common carp
<…)
6
33,300
”
catfish, tench (…)
common
carp
6
100,000
”
common
carp
6
41,600
”
catfish
12
20,800
”
catfish, common carp
20
120,000
”
catfish, common carp
13
6,150
"
catfish, common carp
Total, ha
101
X,11.
50,702
___—
Grand total,
165 ha,næanfarm area, 8 ha
________________________________________________________________________..
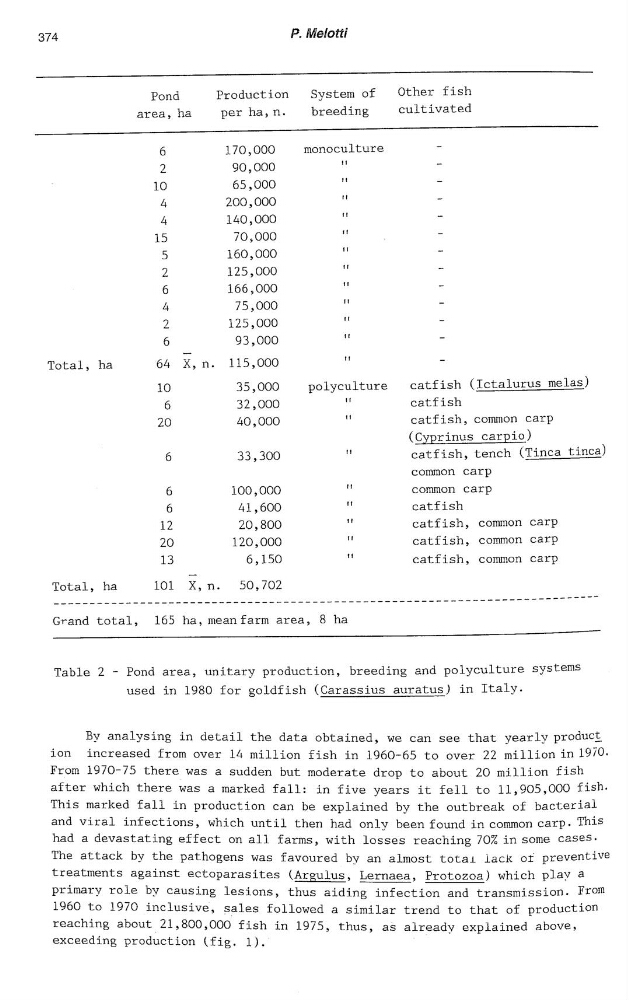
Table 2 — Pond area, unitary production, breeding and polyculture systems
used in 1980 for goldfish (Carassius auratus) in Italy.
By analysing in detail the data obtained, we can see that year1y'product
ion
increased from over 14 million fish in 1960—65 to over 22 million ù11970.
From 1970-75 there was a sudden but moderate drop to about 20 million fish
after Which there was a marked fall:
in five years it fell to 11,905,000 fishThis marked fall in production can be explained by the outbreak of bacterial
and viral infections, which until then had only been.found in common carp. This
had a devastating effect on all farms, with losses reaching 702 in some casesThe attack by the pathogens was favoured by an almost total lack of preventive
treatments
against ectoparasites (Argulus, Lernaea, Protozoa) which play a
primary role by causing lesions, thus aiding infection and transmission. From
1960 to 1970 inclusive, sales followed a similar trend to that of production
reaching about 21,800,000 fish in 1975, thus, as already explained above,
exceeding production (fig. 1)_
P. Meloz‘ti
_________________________________________________________—_____________
Pond
Production
System of
Other fish
area, ha
per
breeding
cultivated
____________________________________________________________________________
6
170,000
monoculture
—
2
90,000
”
*
'
10
65,000
”
-
4
200,000
”
-
4
140,000
”
—
15
70,000
”
.
-
5
160,000
”
—
2
125,000
”
—
6
166,000
”
—
4
75,000
“
—
2
125,000
”
—
6
93,000
”
—
Total, ha
64
X,IL
115,000
”
—
10
35,000
polycu1ture
catfish (Icta1urus melas)
6
32,000
”
catfish
20
40,000
”
catfish, common carp
<…)
6
33,300
”
catfish, tench (…)
common
carp
6
100,000
”
common
carp
6
41,600
”
catfish
12
20,800
”
catfish, common carp
20
120,000
”
catfish, common carp
13
6,150
"
catfish, common carp
Total, ha
101
X,11.
50,702
___—
Grand total,
165 ha,næanfarm area, 8 ha
________________________________________________________________________..
Table 2 — Pond area, unitary production, breeding and polyculture systems
used in 1980 for goldfish (Carassius auratus) in Italy.
By analysing in detail the data obtained, we can see that year1y'product
ion
increased from over 14 million fish in 1960—65 to over 22 million ù11970.
From 1970-75 there was a sudden but moderate drop to about 20 million fish
after Which there was a marked fall:
in five years it fell to 11,905,000 fishThis marked fall in production can be explained by the outbreak of bacterial
and viral infections, which until then had only been.found in common carp. This
had a devastating effect on all farms, with losses reaching 702 in some casesThe attack by the pathogens was favoured by an almost total lack of preventive
treatments
against ectoparasites (Argulus, Lernaea, Protozoa) which play a
primary role by causing lesions, thus aiding infection and transmission. From
1960 to 1970 inclusive, sales followed a similar trend to that of production
reaching about 21,800,000 fish in 1975, thus, as already explained above,
exceeding production (fig. 1)_