

Çarp PradUCÜOD
f.
«
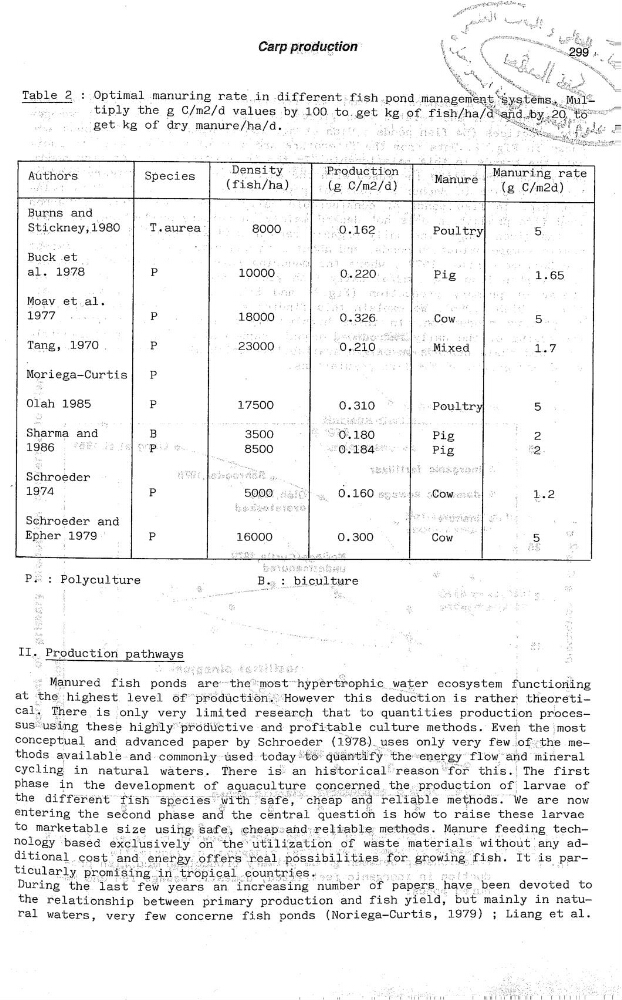
Table 2_: Optimal manuring rate in different fish pond
,tiply the g C/m2/d value$ by
Q get
of
…
.
rate
Authors
S ec1es
;
‘
z
p
,,
;
(g C/_m_2/d)
_(gÇ/m2d)
_
.
Î
_.
al. 1978
P
_
10000
,
,
_
…
Pig
_
,
1,65
1977
.
…
.
P
18000 .
_
_
0,320
…
5
.
…
Moriega—Curtis
P
.
01ah 1985
F
17500
0.310
à
‘
Poultr
«
5
Sharmâ and
B
3500
-
*“d.180
Pig
2
1986
8500
‘
”»
Pig
Schroeder
’_î‘î
\
\
'
"
1974
P
50Q_®
0.160
1.2
SÇhroeder and
'
Epher 1979 '
P
16000
0300
C0W
5
Polyculture
_”
Production pathways
fish
ponds
are
ecosystem functioing
at
the highest level
this
deduétion is rather theoreti—
is
only very limited research that to quantities production proces—
these
culture methods.
Even
the most
conceptuel and advanced paper by Schroeder
only very
me—
thods available and
CYCling in natural waters. There islam
for
this.£The
first
phase
in the development of aquaculture
Of
the different ' fiSh‘ spec1esw1thsafe‘ché‘äp“a‘hç“‘fè11‘gp1e
We
are
now
entering the seëond phase and the cëntral duestion is how to raise these larvae
to marketable Size
Manure feeding tech—
n°loäy based
the utilïZation of waste materials without any ad—
ditional
for gnQWihgäxfish- It is Per—
During the last few years
number
of papers
devoted
to
the relationship between primary production and fish yield, but mainly
in
natu—
ral
waters, very few concerne fish ponds
(Noriega—Curtis,
1979)
;
Liang et al.
\
\
\\
‘
\\
\\\ \\\ \\
\
\\\\\\
\\
\
f.
«
Table 2_: Optimal manuring rate in different fish pond
,tiply the g C/m2/d value$ by
Q get
of
…
.
rate
Authors
S ec1es
;
‘
z
p
,,
;
(g C/_m_2/d)
_(gÇ/m2d)
_
.
Î
_.
al. 1978
P
_
10000
,
,
_
…
Pig
_
,
1,65
1977
.
…
.
P
18000 .
_
_
0,320
…
5
.
…
Moriega—Curtis
P
.
01ah 1985
F
17500
0.310
à
‘
Poultr
«
5
Sharmâ and
B
3500
-
*“d.180
Pig
2
1986
8500
‘
”»
Pig
Schroeder
’_î‘î
\
\
'
"
1974
P
50Q_®
0.160
1.2
SÇhroeder and
'
Epher 1979 '
P
16000
0300
C0W
5
Polyculture
_”
Production pathways
fish
ponds
are
ecosystem functioing
at
the highest level
this
deduétion is rather theoreti—
is
only very limited research that to quantities production proces—
these
culture methods.
Even
the most
conceptuel and advanced paper by Schroeder
only very
me—
thods available and
CYCling in natural waters. There islam
for
this.£The
first
phase
in the development of aquaculture
Of
the different ' fiSh‘ spec1esw1thsafe‘ché‘äp“a‘hç“‘fè11‘gp1e
We
are
now
entering the seëond phase and the cëntral duestion is how to raise these larvae
to marketable Size
Manure feeding tech—
n°loäy based
the utilïZation of waste materials without any ad—
ditional
for gnQWihgäxfish- It is Per—
During the last few years
number
of papers
devoted
to
the relationship between primary production and fish yield, but mainly
in
natu—
ral
waters, very few concerne fish ponds
(Noriega—Curtis,
1979)
;
Liang et al.
\
\
\\
‘
\\
\\\ \\\ \\
\
\\\\\\
\\
\