

300
J. Olah
1981).
In
1985
a
comparative study was realized in Hungary and India on pri—
mary
production
and
related
fish
yields in fish ponds with varying manage—
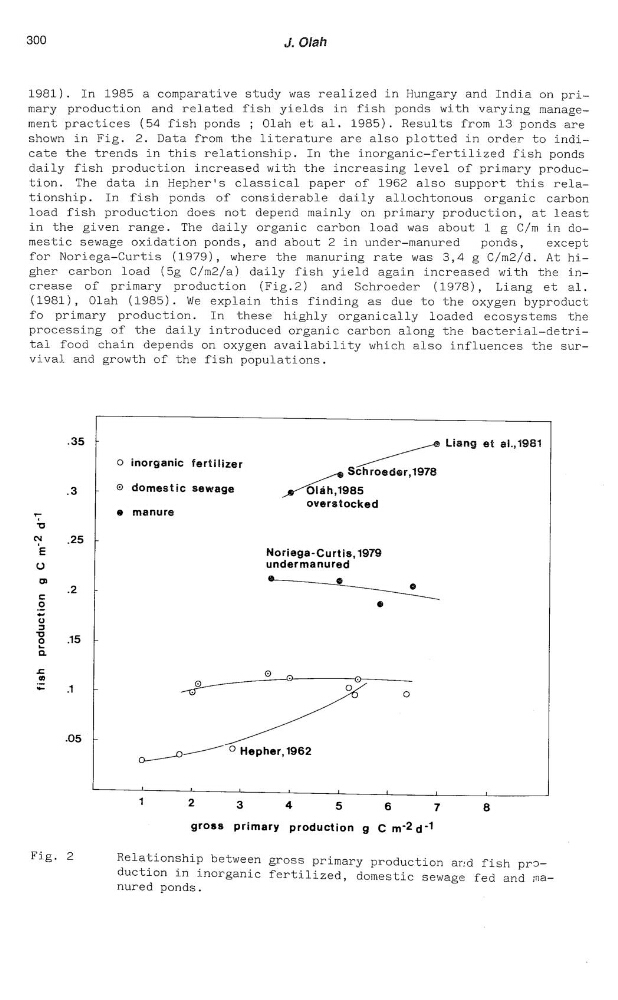
ment practices (54 fish ponds ; Olah et al. 1985). Results from 13 ponds are
shown
in
Fig.
2.
Data
from the
literature
are
also plotted in order to indi—
cate
the
trends
in
this relationship. In the inorganic—fertilized fish ponds
daily fish production increased with the increasing level of primary produc—
tion.
The
data
in
Hepher's classical paper of 1962 also support this rela—
tionship.
In
fish
ponds
of
considerable
daily allochtonous
organic
carbon
load
fish
production does not depend mainly on primary production, at least
in
the
given range.
The
daily organic carbon load was about 1 g C/m in do—
mestic
sewage
oxidation ponds, and about 2 in under—manured
ponds,
except
for
Noriega—Curtis
(1979), where the manuring rate was 3,4 g C/m2/d. At hi—
gher
carbon
load
(5g C/m2/a) daily fish yield again increased with the in—
crease
of
primary
production
(Fig.2)
and
Schroeder
(1978),
Liang et al.
(1981),
Olah
(1985).
We
explain this finding as due to the oxygen byproduct
fo
primary
production.
In
these
highly
organically
loaded
ecosystems
the
processing of the daily introduced organic carbon along the bacterial—detri—
tal
food
chain
depends on oxygen availability which also influences the sur—
vival
and growth of the fish populations.
.35
Liang et al.,1981
0
inor anic !‘
t"
/
9
er ihzer
Schroeder,1978
_3
@
domestic sewage
0làh,1985
overstocked
,.
o
manure
'o
°}
.25
E
Noriega-Curtis,1979
0
undermanured
ou
2
=
.
.9
°
8
:
g
.15
a.
-=
o
n
o\
..
®
_
_.
o
.05
/
/ 0 He her,1962
0/0
p
1
2
3
4
5
6
7
8
gross
primary production 9 C m'2d'1
Fig. 2
Relationship
between gross primary production and fish pri)—
duct1on 1n inorganic fertilized, domestic sewage fed and Ina—
nured ponds.
J. Olah
1981).
In
1985
a
comparative study was realized in Hungary and India on pri—
mary
production
and
related
fish
yields in fish ponds with varying manage—
ment practices (54 fish ponds ; Olah et al. 1985). Results from 13 ponds are
shown
in
Fig.
2.
Data
from the
literature
are
also plotted in order to indi—
cate
the
trends
in
this relationship. In the inorganic—fertilized fish ponds
daily fish production increased with the increasing level of primary produc—
tion.
The
data
in
Hepher's classical paper of 1962 also support this rela—
tionship.
In
fish
ponds
of
considerable
daily allochtonous
organic
carbon
load
fish
production does not depend mainly on primary production, at least
in
the
given range.
The
daily organic carbon load was about 1 g C/m in do—
mestic
sewage
oxidation ponds, and about 2 in under—manured
ponds,
except
for
Noriega—Curtis
(1979), where the manuring rate was 3,4 g C/m2/d. At hi—
gher
carbon
load
(5g C/m2/a) daily fish yield again increased with the in—
crease
of
primary
production
(Fig.2)
and
Schroeder
(1978),
Liang et al.
(1981),
Olah
(1985).
We
explain this finding as due to the oxygen byproduct
fo
primary
production.
In
these
highly
organically
loaded
ecosystems
the
processing of the daily introduced organic carbon along the bacterial—detri—
tal
food
chain
depends on oxygen availability which also influences the sur—
vival
and growth of the fish populations.
.35
Liang et al.,1981
0
inor anic !‘
t"
/
9
er ihzer
Schroeder,1978
_3
@
domestic sewage
0làh,1985
overstocked
,.
o
manure
'o
°}
.25
E
Noriega-Curtis,1979
0
undermanured
ou
2
=
.
.9
°
8
:
g
.15
a.
-=
o
n
o\
..
®
_
_.
o
.05
/
/ 0 He her,1962
0/0
p
1
2
3
4
5
6
7
8
gross
primary production 9 C m'2d'1
Fig. 2
Relationship
between gross primary production and fish pri)—
duct1on 1n inorganic fertilized, domestic sewage fed and Ina—
nured ponds.