

Cod (Gadus morhua) and Salmon (Salmo salar). Expressed sequence tag
(EST) interpretation has allowed for elucidation of many fish genes. EST interpretation is a process of randomly selecting a clone from the cDNA library, setting a
base sequence from the 3′ or 5′ end, and comparing that sequence with amino acid
sequences registered in a database (Wittbrodt et al. 1998).
EST interpretation is also helpful in discovering new genes and interpreting the
characteristic genes expressed in various tissues and organs. Body mapping offers
data categorized by the organs and tissues that express genes; by analyzing the
mRNA types and expression frequency in a single organ or tissue and comparing
the data with other organs and tissues, it is possible to estimate whether the gene in
question is a housekeeping gene expressed in many different organs or a characteristic gene of that organ. This process was used to build LIFESED, a human
cDNA database that includes information on gene expression frequency, and
possible commercialization of genome information, such as database access sharing, is under consideration (Heikkila et al. 1982).
As of January 1, 2013, the zebrafish accounted for the largest number of clones
input through EST interpretation of fish, followed by the Japanese rice fish
(Table 3.2).
Genomic analysis of fish has taken place at a comparable rate to human or rice
genome analysis, but the full-scale effort launched in 1999 (chiefly in the U.S.) to
conduct genomic or EST analysis of the zebrafish offers good news for those
involved in analyzing the genes of the fish that serve as food resources for us. With
the advancements to come in applied research to understand and improve fish
through gene analysis, genomic analysis should also be performed for Korea’s local
fish species.
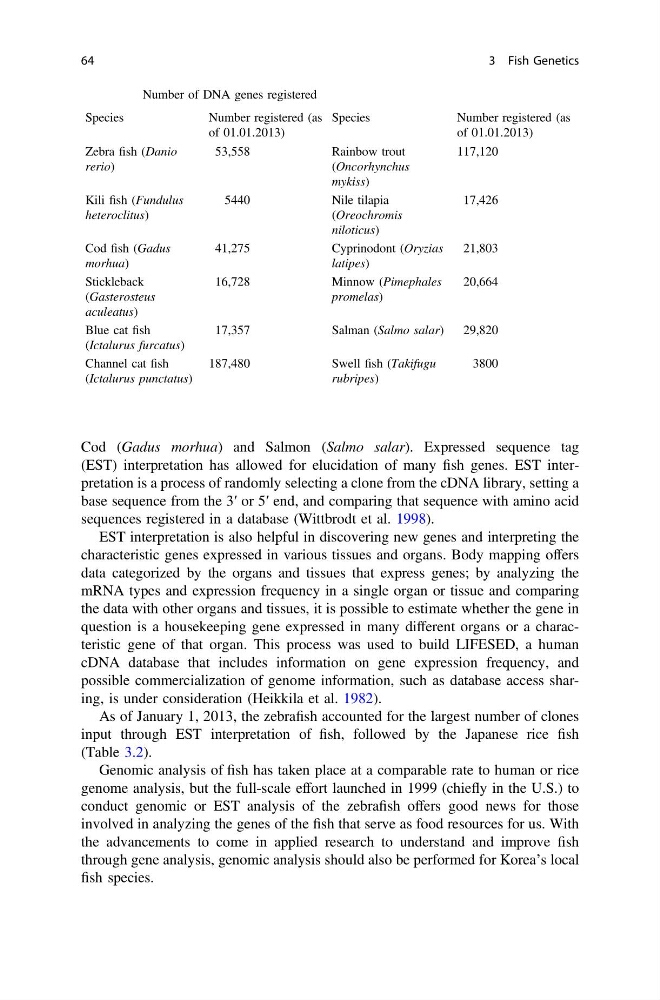
Table 3.1 Number of DNA genes registered
Species
Number registered (as
of 01.01.2013)
Species
Number registered (as
of 01.01.2013)
Zebra fish (Danio
rerio)
53,558
Rainbow trout
(Oncorhynchus
mykiss)
117,120
Kili fish (Fundulus
heteroclitus)
5440
Nile tilapia
(Oreochromis
niloticus)
17,426
Cod fish (Gadus
morhua)
41,275
Cyprinodont (Oryzias
latipes)
21,803
Stickleback
(Gasterosteus
aculeatus)
16,728
Minnow (Pimephales
promelas)
20,664
Blue cat fish
(Ictalurus furcatus)
17,357
Salman (Salmo salar)
29,820
Channel cat fish
(Ictalurus punctatus)
187,480
Swell fish (Takifugu
rubripes)
3800
64
3 Fish Genetics
(EST) interpretation has allowed for elucidation of many fish genes. EST interpretation is a process of randomly selecting a clone from the cDNA library, setting a
base sequence from the 3′ or 5′ end, and comparing that sequence with amino acid
sequences registered in a database (Wittbrodt et al. 1998).
EST interpretation is also helpful in discovering new genes and interpreting the
characteristic genes expressed in various tissues and organs. Body mapping offers
data categorized by the organs and tissues that express genes; by analyzing the
mRNA types and expression frequency in a single organ or tissue and comparing
the data with other organs and tissues, it is possible to estimate whether the gene in
question is a housekeeping gene expressed in many different organs or a characteristic gene of that organ. This process was used to build LIFESED, a human
cDNA database that includes information on gene expression frequency, and
possible commercialization of genome information, such as database access sharing, is under consideration (Heikkila et al. 1982).
As of January 1, 2013, the zebrafish accounted for the largest number of clones
input through EST interpretation of fish, followed by the Japanese rice fish
(Table 3.2).
Genomic analysis of fish has taken place at a comparable rate to human or rice
genome analysis, but the full-scale effort launched in 1999 (chiefly in the U.S.) to
conduct genomic or EST analysis of the zebrafish offers good news for those
involved in analyzing the genes of the fish that serve as food resources for us. With
the advancements to come in applied research to understand and improve fish
through gene analysis, genomic analysis should also be performed for Korea’s local
fish species.
Table 3.1 Number of DNA genes registered
Species
Number registered (as
of 01.01.2013)
Species
Number registered (as
of 01.01.2013)
Zebra fish (Danio
rerio)
53,558
Rainbow trout
(Oncorhynchus
mykiss)
117,120
Kili fish (Fundulus
heteroclitus)
5440
Nile tilapia
(Oreochromis
niloticus)
17,426
Cod fish (Gadus
morhua)
41,275
Cyprinodont (Oryzias
latipes)
21,803
Stickleback
(Gasterosteus
aculeatus)
16,728
Minnow (Pimephales
promelas)
20,664
Blue cat fish
(Ictalurus furcatus)
17,357
Salman (Salmo salar)
29,820
Channel cat fish
(Ictalurus punctatus)
187,480
Swell fish (Takifugu
rubripes)
3800
64
3 Fish Genetics