

suggested. This reduction in genetic diversity can be understood more clearly
through the use of microsatellite DNA markers (Fig. 5.10) (Mace and Lande 1991;
Seki et al. 1995).
5.6.6 Inbreeding Coefficient Estimation
In inbreeding populations, heterozygote frequency declines. If H o is taken to represent the heterozygosity rate under conditions of random mating within a wild
population and F t is the inbreeding coefficient when artificial seedling production is
carried out through t generations, then the heterozygosity rate after t generations is
shown by the equation H t = H o Á(1 − F t ) (Li and Horvitz 1953).
While it is not possible to estimate gene loci in DNA fingerprinting, each band
appears in accordance with a Mendelian mode of inheritance. The average number
of bands appearance thus declines in inbred populations due to reduced hetero
frequency. Indeed, examination of the number of bands appearing in a specific
section of the membrane in DNA fingerprinting has shown a definite decline in the
cleavage-blocked gynogenetic diploids (F = 1) and clonal populations.
Because microsatellite DNA polymorphs enable measurement of the heterozygosity rate at each gene locus, the inbreeding coefficient F for generation t can be
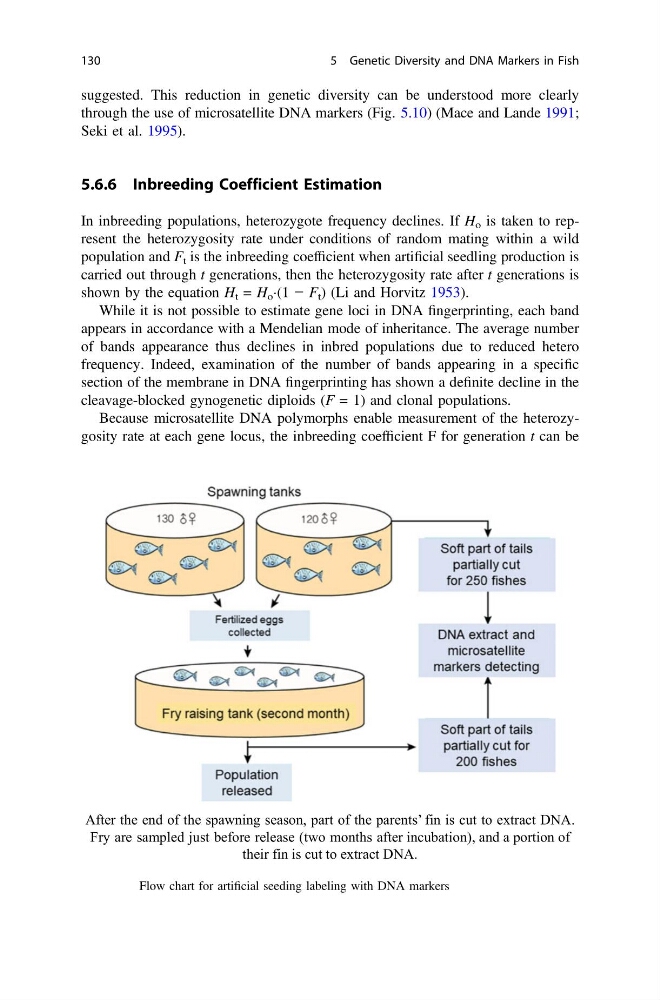
After the end of the spawning season, part of the parents’ fin is cut to extract DNA.
Fry are sampled just before release (two months after incubation), and a portion of
their fin is cut to extract DNA.
Fig. 5.11 Flow chart for artificial seeding labeling with DNA markers
130
5 Genetic Diversity and DNA Markers in Fish
through the use of microsatellite DNA markers (Fig. 5.10) (Mace and Lande 1991;
Seki et al. 1995).
5.6.6 Inbreeding Coefficient Estimation
In inbreeding populations, heterozygote frequency declines. If H o is taken to represent the heterozygosity rate under conditions of random mating within a wild
population and F t is the inbreeding coefficient when artificial seedling production is
carried out through t generations, then the heterozygosity rate after t generations is
shown by the equation H t = H o Á(1 − F t ) (Li and Horvitz 1953).
While it is not possible to estimate gene loci in DNA fingerprinting, each band
appears in accordance with a Mendelian mode of inheritance. The average number
of bands appearance thus declines in inbred populations due to reduced hetero
frequency. Indeed, examination of the number of bands appearing in a specific
section of the membrane in DNA fingerprinting has shown a definite decline in the
cleavage-blocked gynogenetic diploids (F = 1) and clonal populations.
Because microsatellite DNA polymorphs enable measurement of the heterozygosity rate at each gene locus, the inbreeding coefficient F for generation t can be
After the end of the spawning season, part of the parents’ fin is cut to extract DNA.
Fry are sampled just before release (two months after incubation), and a portion of
their fin is cut to extract DNA.
Fig. 5.11 Flow chart for artificial seeding labeling with DNA markers
130
5 Genetic Diversity and DNA Markers in Fish