

5.6.4 Genetic Diversity in Chromosomally Manipulated Fish
Artificial gynogenetic diploids: BSI comparison for normal ayu diploids,
cleavage-blocked gynogenetic diploids, and second-generation clones within the
same film has shown the clones to possess the maximum BSI value of one, while
normal diploids had a low value of 0.527. The BSI for cleavage-blocked gynogenetic diploids was even lower at 0.314. The inbreeding coefficient F equaled one
for the cleavage-blocked gynogenetic diploids and around 0.5 for polar body
emission-blocked gynogenetic diploids, albeit with a sharper difference between
organisms in the cleavage-blocked case because the genotypes separated. The
number of bands appearing also declined as a result of joining of similar bands.
This theoretical prediction has been tested through average BSI within populations
and the number of bands detected (Arai 2001; Takagi et al. 1993).
In the case of microsatellite DNA polymorphs, the heterozygosity rate for
cleavage-blocked gynogenetic diploids is reported to be zero; for polar body
emission-blocked gynogenetic diploids, it is reported to range between 0 and 1.0,
depending on the distance between the marker gene and centromere. The fact that
this characteristic arises due to crossing between homologous chromosomes during
meiosis may be used to estimate the distance between G and C.
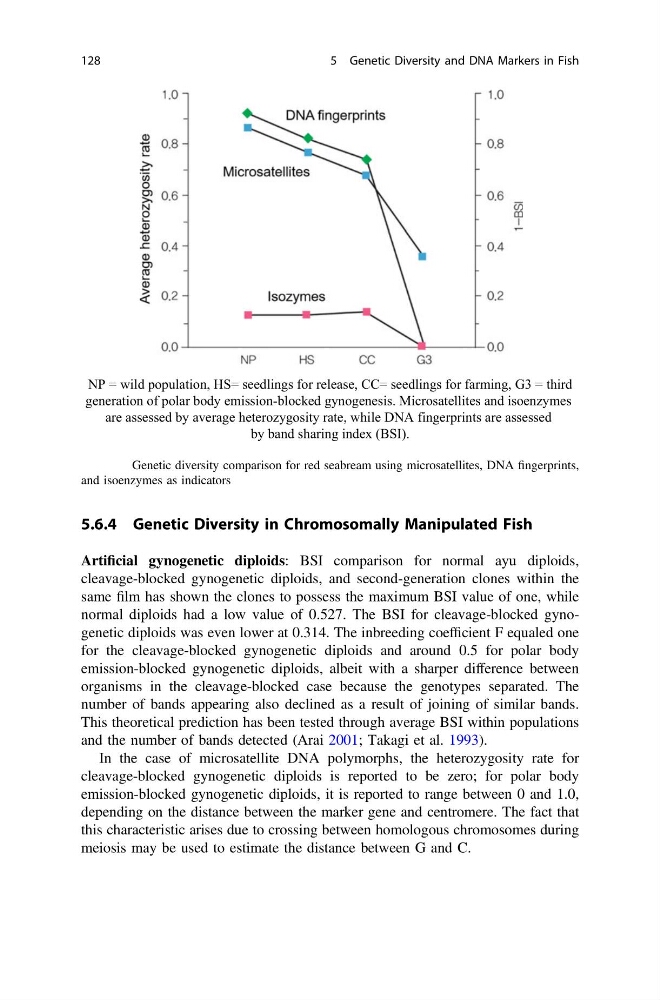
NP = wild population, HS= seedlings for release, CC= seedlings for farming, G3 = third
generation of polar body emission-blocked gynogenesis. Microsatellites and isoenzymes
are assessed by average heterozygosity rate, while DNA fingerprints are assessed
by band sharing index (BSI).
Fig. 5.9 Genetic diversity comparison for red seabream using microsatellites, DNA fingerprints,
and isoenzymes as indicators
128
5 Genetic Diversity and DNA Markers in Fish
Artificial gynogenetic diploids: BSI comparison for normal ayu diploids,
cleavage-blocked gynogenetic diploids, and second-generation clones within the
same film has shown the clones to possess the maximum BSI value of one, while
normal diploids had a low value of 0.527. The BSI for cleavage-blocked gynogenetic diploids was even lower at 0.314. The inbreeding coefficient F equaled one
for the cleavage-blocked gynogenetic diploids and around 0.5 for polar body
emission-blocked gynogenetic diploids, albeit with a sharper difference between
organisms in the cleavage-blocked case because the genotypes separated. The
number of bands appearing also declined as a result of joining of similar bands.
This theoretical prediction has been tested through average BSI within populations
and the number of bands detected (Arai 2001; Takagi et al. 1993).
In the case of microsatellite DNA polymorphs, the heterozygosity rate for
cleavage-blocked gynogenetic diploids is reported to be zero; for polar body
emission-blocked gynogenetic diploids, it is reported to range between 0 and 1.0,
depending on the distance between the marker gene and centromere. The fact that
this characteristic arises due to crossing between homologous chromosomes during
meiosis may be used to estimate the distance between G and C.
NP = wild population, HS= seedlings for release, CC= seedlings for farming, G3 = third
generation of polar body emission-blocked gynogenesis. Microsatellites and isoenzymes
are assessed by average heterozygosity rate, while DNA fingerprints are assessed
by band sharing index (BSI).
Fig. 5.9 Genetic diversity comparison for red seabream using microsatellites, DNA fingerprints,
and isoenzymes as indicators
128
5 Genetic Diversity and DNA Markers in Fish