

are used in industrial processes, some amounts are emitted into the
environment as gases or particulates. These, in turn, are precipitated onto
the ground and subsequently absorbed in soils. The absorbed F may assume
different forms, depending on such factors as soil pH, organic matter and clay
content, and exchangeable calcium (Ca) content.
10.2.5 FOODS
Because F is ubiquitous, virtually all foods contain trace amounts of the
mineral. Fluoride-containing foods and beverages are, therefore, the most
important sources of F intake. F intake from food and beverages by a male
residing in a fluoridated community in the U.S. is about 1 to 3 mg/day. It is
decreased to 1.0 mg/day in a nonfluoridated area.
4 The intake from drinking
water ranges from 0.1 to 0.5 mg/day in nonfluoridated communities, whereas
in fluoridated communities it may amount to 1 to 2 mg/day. Total F intakes in
several countries are much higher than those in the U.S. For instance, in the
West Midlands, the region of the U.K. with the longest history of fluoridation,
a large number of residents were reported to take in 3 mg F or more per day.
5
Plants can absorb F from soil, water, or the atmosphere. F contents in
plants range from 0.1 to 10 ppm (dry basis), depending on the species. Several
plant species are known as F accumulators. Examples include camellia
(620 ppm), tea (leaves, 760 ppm), and elderberry (3600 ppm, dry basis). It is
interesting to note that although tea leaves are an important F-accumulator,
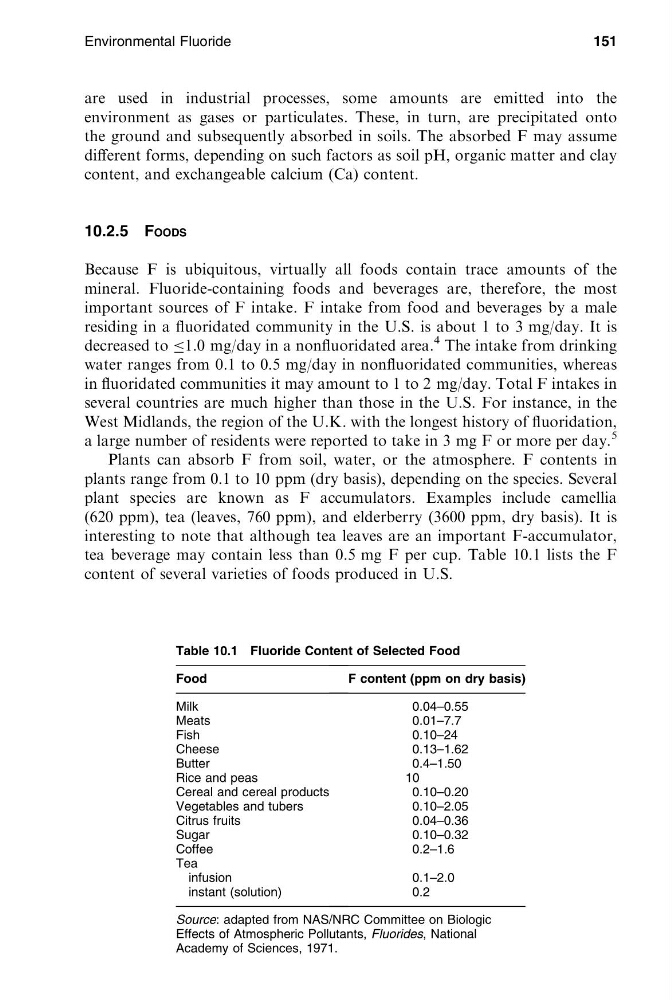
tea beverage may contain less than 0.5 mg F per cup. Table 10.1 lists the F
content of several varieties of foods produced in U.S.
Environmental Fluoride
151
[16:52 26/8/04 P:/CRC PRESS/4365 MING-HO.751 (1670)/4365-010.3d]
Ref: 4365 MING-HO YU Chap-010 Page: 151 149-170
Table 10.1 Fluoride Content of Selected Food
Food
F content (ppm on dry basis)
Milk
0.04–0.55
Meats
0.01–7.7
Fish
0.10–24
Cheese
0.13–1.62
Butter
0.4–1.50
Rice and peas
10
Cereal and cereal products
0.10–0.20
Vegetables and tubers
0.10–2.05
Citrus fruits
0.04–0.36
Sugar
0.10–0.32
Coffee
0.2–1.6
Tea
infusion
0.1–2.0
instant (solution)
0.2
Source: adapted from NAS/NRC Committee on Biologic
Effects of Atmospheric Pollutants, Fluorides, National
Academy of Sciences, 1971.
environment as gases or particulates. These, in turn, are precipitated onto
the ground and subsequently absorbed in soils. The absorbed F may assume
different forms, depending on such factors as soil pH, organic matter and clay
content, and exchangeable calcium (Ca) content.
10.2.5 FOODS
Because F is ubiquitous, virtually all foods contain trace amounts of the
mineral. Fluoride-containing foods and beverages are, therefore, the most
important sources of F intake. F intake from food and beverages by a male
residing in a fluoridated community in the U.S. is about 1 to 3 mg/day. It is
decreased to 1.0 mg/day in a nonfluoridated area.
4 The intake from drinking
water ranges from 0.1 to 0.5 mg/day in nonfluoridated communities, whereas
in fluoridated communities it may amount to 1 to 2 mg/day. Total F intakes in
several countries are much higher than those in the U.S. For instance, in the
West Midlands, the region of the U.K. with the longest history of fluoridation,
a large number of residents were reported to take in 3 mg F or more per day.
5
Plants can absorb F from soil, water, or the atmosphere. F contents in
plants range from 0.1 to 10 ppm (dry basis), depending on the species. Several
plant species are known as F accumulators. Examples include camellia
(620 ppm), tea (leaves, 760 ppm), and elderberry (3600 ppm, dry basis). It is
interesting to note that although tea leaves are an important F-accumulator,
tea beverage may contain less than 0.5 mg F per cup. Table 10.1 lists the F
content of several varieties of foods produced in U.S.
Environmental Fluoride
151
[16:52 26/8/04 P:/CRC PRESS/4365 MING-HO.751 (1670)/4365-010.3d]
Ref: 4365 MING-HO YU Chap-010 Page: 151 149-170
Table 10.1 Fluoride Content of Selected Food
Food
F content (ppm on dry basis)
Milk
0.04–0.55
Meats
0.01–7.7
Fish
0.10–24
Cheese
0.13–1.62
Butter
0.4–1.50
Rice and peas
10
Cereal and cereal products
0.10–0.20
Vegetables and tubers
0.10–2.05
Citrus fruits
0.04–0.36
Sugar
0.10–0.32
Coffee
0.2–1.6
Tea
infusion
0.1–2.0
instant (solution)
0.2
Source: adapted from NAS/NRC Committee on Biologic
Effects of Atmospheric Pollutants, Fluorides, National
Academy of Sciences, 1971.