

Copyright © National Academy of Sciences. All rights reserved.
Solar and Space Physics: A Science for a Technological Society
378
SOLAR AND SPACE PHYSICS: A SCIENCE FOR A TECHNOLOGICAL SOCIETY
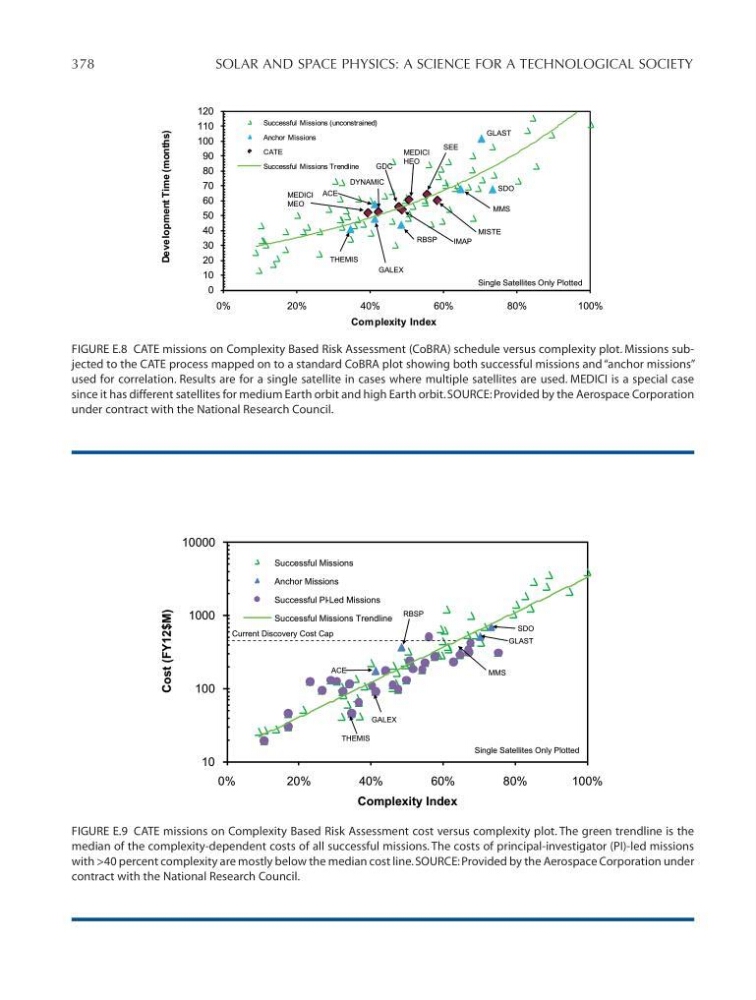
FIGURE E.8 CATE missions on Complexity Based Risk Assessment (CoBRA) schedule versus complexity plot. Missions subjected to the CATE process mapped on to a standard CoBRA plot showing both successful missions and “anchor missions”
used for correlation. Results are for a single satellite in cases where multiple satellites are used. MEDICI is a special case
since it has different satellites for medium Earth orbit and high Earth orbit. SOURCE: Provided by the Aerospace Corporation
under contract with the National Research Council.
0
10
20
30
40
50
60
70
80
90
100
110
120
0%
20%
4 0%
60%
8 0%
100%
Development Time (months)
Complexity Index
Successful Missions (unconstrained)
Anchor Missions
CATE
Successful Missions Trendline
MEDICI
MEO
SEE
MEDICI
HEO
DYNAMIC
IMAP
GDC
MISTE
MMS
RBSP
ACE
GALEX
THEMIS
SDO
GLAST
Single Satellites Only Plotted
Figure E-8
FIGURE E.9 CATE missions on Complexity Based Risk Assessment cost versus complexity plot. The green trendline is the
median of the complexity-dependent costs of all successful missions. The costs of principal-investigator (PI)-led missions
with >40 percent complexity are mostly below the median cost line. SOURCE: Provided by the Aerospace Corporation under
contract with the National Research Council.
10
100
1000
10000
0%
20%
4 0%
60%
8 0%
100%
Cost (FY12$M)
Complexity Index
Successful Missions
Anchor Missions
Successful PI -Led Missions
Successful Missions Trendline
MMS
RBSP
ACE
GALEX
THEMIS
SDO
GLAST
Single Satellites Only Plotted
Current Discovery Cost Cap
Figure E-9
Solar and Space Physics: A Science for a Technological Society
378
SOLAR AND SPACE PHYSICS: A SCIENCE FOR A TECHNOLOGICAL SOCIETY
FIGURE E.8 CATE missions on Complexity Based Risk Assessment (CoBRA) schedule versus complexity plot. Missions subjected to the CATE process mapped on to a standard CoBRA plot showing both successful missions and “anchor missions”
used for correlation. Results are for a single satellite in cases where multiple satellites are used. MEDICI is a special case
since it has different satellites for medium Earth orbit and high Earth orbit. SOURCE: Provided by the Aerospace Corporation
under contract with the National Research Council.
0
10
20
30
40
50
60
70
80
90
100
110
120
0%
20%
4 0%
60%
8 0%
100%
Development Time (months)
Complexity Index
Successful Missions (unconstrained)
Anchor Missions
CATE
Successful Missions Trendline
MEDICI
MEO
SEE
MEDICI
HEO
DYNAMIC
IMAP
GDC
MISTE
MMS
RBSP
ACE
GALEX
THEMIS
SDO
GLAST
Single Satellites Only Plotted
Figure E-8
FIGURE E.9 CATE missions on Complexity Based Risk Assessment cost versus complexity plot. The green trendline is the
median of the complexity-dependent costs of all successful missions. The costs of principal-investigator (PI)-led missions
with >40 percent complexity are mostly below the median cost line. SOURCE: Provided by the Aerospace Corporation under
contract with the National Research Council.
10
100
1000
10000
0%
20%
4 0%
60%
8 0%
100%
Cost (FY12$M)
Complexity Index
Successful Missions
Anchor Missions
Successful PI -Led Missions
Successful Missions Trendline
MMS
RBSP
ACE
GALEX
THEMIS
SDO
GLAST
Single Satellites Only Plotted
Current Discovery Cost Cap
Figure E-9