

Copyright © National Academy of Sciences. All rights reserved.
Solar and Space Physics: A Science for a Technological Society
APPENDIX E
379
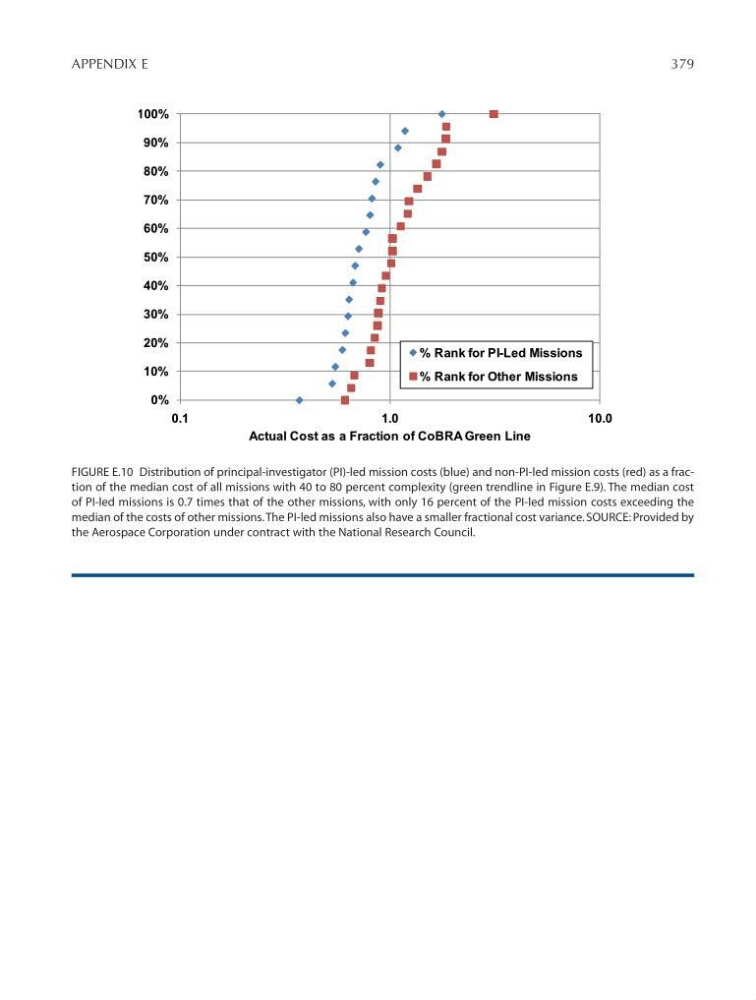
FIGURE E.10 Distribution of principal-investigator (PI)-led mission costs (blue) and non-PI-led mission costs (red) as a fraction of the median cost of all missions with 40 to 80 percent complexity (green trendline in Figure E.9). The median cost
of PI-led missions is 0.7 times that of the other missions, with only 16 percent of the PI-led mission costs exceeding the
median of the costs of other missions. The PI-led missions also have a smaller fractional cost variance. SOURCE: Provided by
the Aerospace Corporation under contract with the National Research Council.
0%
10%
20%
30%
40%
50%
60%
70%
80%
90%
100%
0.1
1 .0
10.0
Actual Cost as a Fraction of CoBRA Green Line
% Rank for PI-Led Missions
% Rank for Other Missions
Figure E-10
Solar and Space Physics: A Science for a Technological Society
APPENDIX E
379
FIGURE E.10 Distribution of principal-investigator (PI)-led mission costs (blue) and non-PI-led mission costs (red) as a fraction of the median cost of all missions with 40 to 80 percent complexity (green trendline in Figure E.9). The median cost
of PI-led missions is 0.7 times that of the other missions, with only 16 percent of the PI-led mission costs exceeding the
median of the costs of other missions. The PI-led missions also have a smaller fractional cost variance. SOURCE: Provided by
the Aerospace Corporation under contract with the National Research Council.
0%
10%
20%
30%
40%
50%
60%
70%
80%
90%
100%
0.1
1 .0
10.0
Actual Cost as a Fraction of CoBRA Green Line
% Rank for PI-Led Missions
% Rank for Other Missions
Figure E-10