

Copyright © National Academy of Sciences. All rights reserved.
Solar and Space Physics: A Science for a Technological Society
372
SOLAR AND SPACE PHYSICS: A SCIENCE FOR A TECHNOLOGICAL SOCIETY
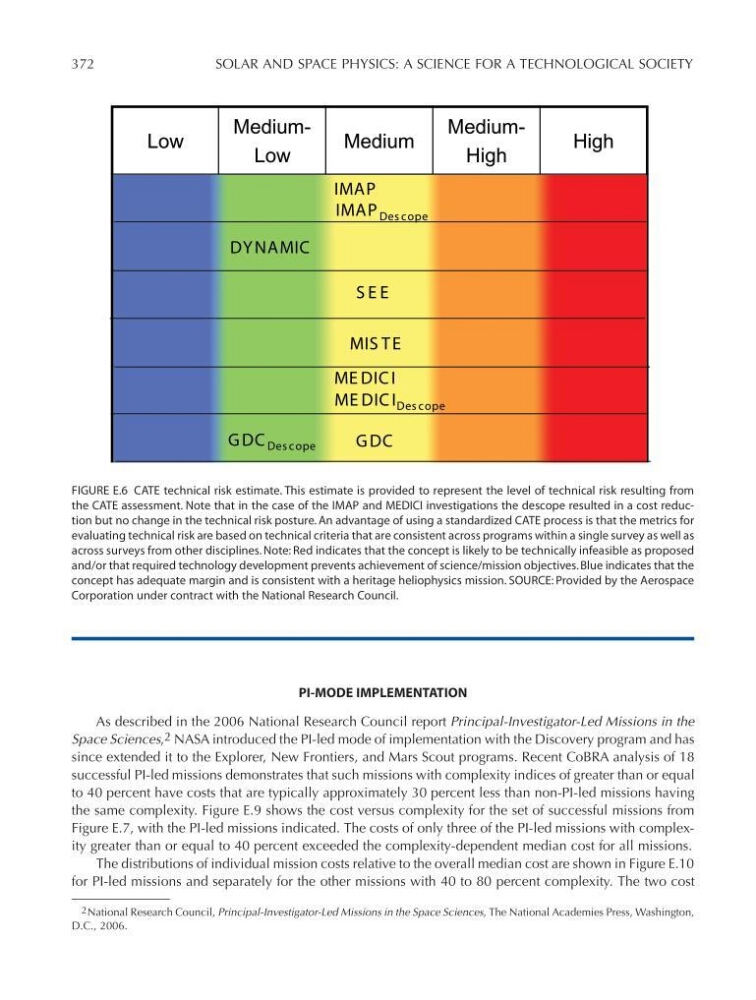
FIGURE E.6 CATE technical risk estimate. This estimate is provided to represent the level of technical risk resulting from
the CATE assessment. Note that in the case of the IMAP and MEDICI investigations the descope resulted in a cost reduction but no change in the technical risk posture. An advantage of using a standardized CATE process is that the metrics for
evaluating technical risk are based on technical criteria that are consistent across programs within a single survey as well as
across surveys from other disciplines. Note: Red indicates that the concept is likely to be technically infeasible as proposed
and/or that required technology development prevents achievement of science/mission objectives. Blue indicates that the
concept has adequate margin and is consistent with a heritage heliophysics mission. SOURCE: Provided by the Aerospace
Corporation under contract with the National Research Council.
Low
MediumLow
Medium
MediumHigh
High
DY NAMIC
IMAP
S E E
ME DIC I
MIS TE
G DC
IMAP Des cope
ME DIC I Des cope
G DC Des cope
Figure E-6
PI-MODE IMPLEMENTATION
As described in the 2006 National Research Council report Principal-Investigator-Led Missions in the
Space Sciences, 2 NASA introduced the PI-led mode of implementation with the Discovery program and has
since extended it to the Explorer, New Frontiers, and Mars Scout programs. Recent CoBRA analysis of 18
successful PI-led missions demonstrates that such missions with complexity indices of greater than or equal
to 40 percent have costs that are typically approximately 30 percent less than non-PI-led missions having
the same complexity. Figure E.9 shows the cost versus complexity for the set of successful missions from
Figure E.7, with the PI-led missions indicated. The costs of only three of the PI-led missions with complexity greater than or equal to 40 percent exceeded the complexity-dependent median cost for all missions.
The distributions of individual mission costs relative to the overall median cost are shown in Figure E.10
for PI-led missions and separately for the other missions with 40 to 80 percent complexity. The two cost
2 National Research Council, Principal-Investigator-Led Missions in the Space Sciences, The National Academies Press, Washington,
D.C., 2006.
Solar and Space Physics: A Science for a Technological Society
372
SOLAR AND SPACE PHYSICS: A SCIENCE FOR A TECHNOLOGICAL SOCIETY
FIGURE E.6 CATE technical risk estimate. This estimate is provided to represent the level of technical risk resulting from
the CATE assessment. Note that in the case of the IMAP and MEDICI investigations the descope resulted in a cost reduction but no change in the technical risk posture. An advantage of using a standardized CATE process is that the metrics for
evaluating technical risk are based on technical criteria that are consistent across programs within a single survey as well as
across surveys from other disciplines. Note: Red indicates that the concept is likely to be technically infeasible as proposed
and/or that required technology development prevents achievement of science/mission objectives. Blue indicates that the
concept has adequate margin and is consistent with a heritage heliophysics mission. SOURCE: Provided by the Aerospace
Corporation under contract with the National Research Council.
Low
MediumLow
Medium
MediumHigh
High
DY NAMIC
IMAP
S E E
ME DIC I
MIS TE
G DC
IMAP Des cope
ME DIC I Des cope
G DC Des cope
Figure E-6
PI-MODE IMPLEMENTATION
As described in the 2006 National Research Council report Principal-Investigator-Led Missions in the
Space Sciences, 2 NASA introduced the PI-led mode of implementation with the Discovery program and has
since extended it to the Explorer, New Frontiers, and Mars Scout programs. Recent CoBRA analysis of 18
successful PI-led missions demonstrates that such missions with complexity indices of greater than or equal
to 40 percent have costs that are typically approximately 30 percent less than non-PI-led missions having
the same complexity. Figure E.9 shows the cost versus complexity for the set of successful missions from
Figure E.7, with the PI-led missions indicated. The costs of only three of the PI-led missions with complexity greater than or equal to 40 percent exceeded the complexity-dependent median cost for all missions.
The distributions of individual mission costs relative to the overall median cost are shown in Figure E.10
for PI-led missions and separately for the other missions with 40 to 80 percent complexity. The two cost
2 National Research Council, Principal-Investigator-Led Missions in the Space Sciences, The National Academies Press, Washington,
D.C., 2006.