

Copyright © National Academy of Sciences. All rights reserved.
Solar and Space Physics: A Science for a Technological Society
APPENDIX E
369
Taurus-XL 2XXX, Taurus-XL 3XXX, Taurus-II, and Falcon 9, were baselined and are capable of meeting all
of the mission design cases that were studied. The Falcon 1 and Athena were treated as variants of the
Taurus-class vehicle and are considered cost-neutral substitutes for the majority of the applications. The
Delta-II was not considered to be available at the time of the mission design activity but is also a viable
substitute with respect to launch capability, although at an unknown cost. It is also unclear whether the
Delta-II will retain launch capabilities at the Eastern Test Range launch facility.
All vehicles (or comparable vehicles at comparable cost) were considered to be available later in the
decade when the first missions would approach a state of launch readiness. The CATE process assumed the
launch vehicle cost to be a pass-through based on an analysis using multiple publicly available sources.
The cost range used in the process started at $60 million for the Taurus-XL 2XXX class and extended up
to $125 million for the Falcon 9 in 2012 dollars. For the vehicles baselined in the design studies, the
potential for cost growth and associated cost risk is considered low, although there is some risk related to
availability of a particular vehicle type.
MISSION COST RESULTS
The cost comparison between the six mission concepts and associated descoped missions is shown in
Figure E.4. For each mission there is a base cost resulting from the probabilistic cost analysis plus the analyzed cost for mission-specific threats and liens. The corresponding schedule results are shown in Figure E.5.
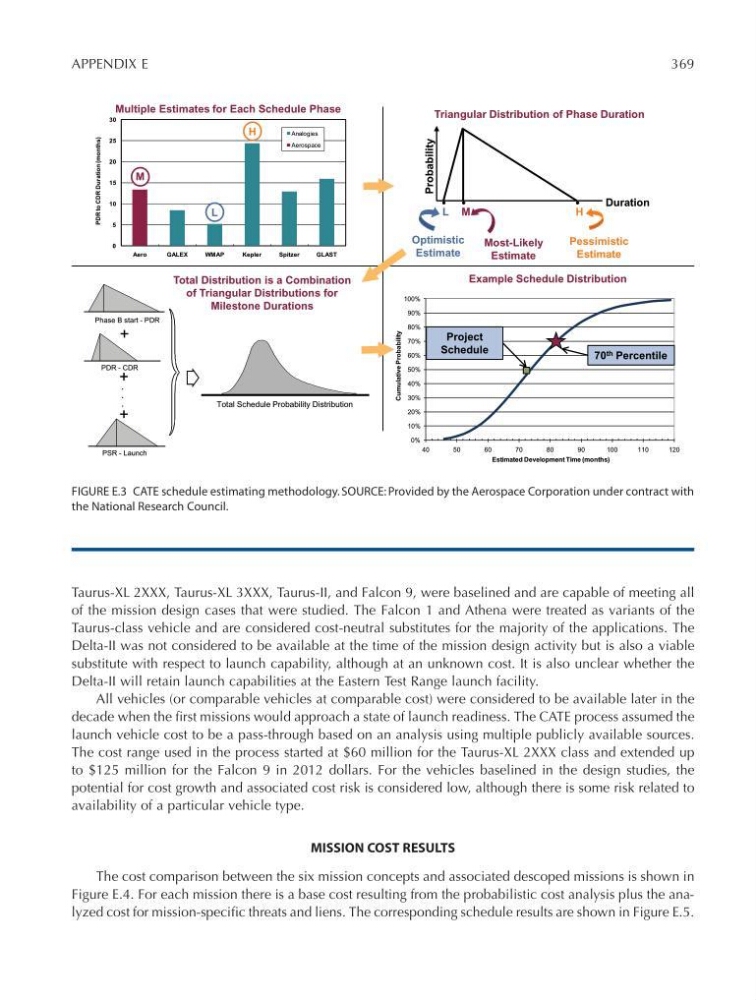
FIGURE E.3 CATE schedule estimating methodology. SOURCE: Provided by the Aerospace Corporation under contract with
the National Research Council.
0%
10%
20%
30%
40%
50%
60%
70%
80%
90%
100%
40
50
60
70
80
90
100
1 10
120
Cumulative Probability
Estimated Development Time (months)
0
5
10
15
20
25
30
Aero
GALEX
W MAP
K epler
S pitzer
GLAST
PDR to CDR Duration (months)
Analogies
Aerospace
Total Distribution is a Combination
of Triangular Distributions for
Milestone Durations
Multiple Estimates for Each Schedule Phase
Example Schedule Distribution
+
+
Phase B start - PDR
Total Schedule Probability Distribution
PDR - CDR
.
.
.
Optimistic
Estimate
Most-Likely
Estimate
Pessimistic
Estimate
Probability
L M
H
Duration
Triangular Distribution of Phase Duration
70 th Percentile
L
M
H
+
PSR - Launch
Project
Schedule
Figure E-3
Solar and Space Physics: A Science for a Technological Society
APPENDIX E
369
Taurus-XL 2XXX, Taurus-XL 3XXX, Taurus-II, and Falcon 9, were baselined and are capable of meeting all
of the mission design cases that were studied. The Falcon 1 and Athena were treated as variants of the
Taurus-class vehicle and are considered cost-neutral substitutes for the majority of the applications. The
Delta-II was not considered to be available at the time of the mission design activity but is also a viable
substitute with respect to launch capability, although at an unknown cost. It is also unclear whether the
Delta-II will retain launch capabilities at the Eastern Test Range launch facility.
All vehicles (or comparable vehicles at comparable cost) were considered to be available later in the
decade when the first missions would approach a state of launch readiness. The CATE process assumed the
launch vehicle cost to be a pass-through based on an analysis using multiple publicly available sources.
The cost range used in the process started at $60 million for the Taurus-XL 2XXX class and extended up
to $125 million for the Falcon 9 in 2012 dollars. For the vehicles baselined in the design studies, the
potential for cost growth and associated cost risk is considered low, although there is some risk related to
availability of a particular vehicle type.
MISSION COST RESULTS
The cost comparison between the six mission concepts and associated descoped missions is shown in
Figure E.4. For each mission there is a base cost resulting from the probabilistic cost analysis plus the analyzed cost for mission-specific threats and liens. The corresponding schedule results are shown in Figure E.5.
FIGURE E.3 CATE schedule estimating methodology. SOURCE: Provided by the Aerospace Corporation under contract with
the National Research Council.
0%
10%
20%
30%
40%
50%
60%
70%
80%
90%
100%
40
50
60
70
80
90
100
1 10
120
Cumulative Probability
Estimated Development Time (months)
0
5
10
15
20
25
30
Aero
GALEX
W MAP
K epler
S pitzer
GLAST
PDR to CDR Duration (months)
Analogies
Aerospace
Total Distribution is a Combination
of Triangular Distributions for
Milestone Durations
Multiple Estimates for Each Schedule Phase
Example Schedule Distribution
+
+
Phase B start - PDR
Total Schedule Probability Distribution
PDR - CDR
.
.
.
Optimistic
Estimate
Most-Likely
Estimate
Pessimistic
Estimate
Probability
L M
H
Duration
Triangular Distribution of Phase Duration
70 th Percentile
L
M
H
+
PSR - Launch
Project
Schedule
Figure E-3