

Copyright © National Academy of Sciences. All rights reserved.
Solar and Space Physics: A Science for a Technological Society
368
SOLAR AND SPACE PHYSICS: A SCIENCE FOR A TECHNOLOGICAL SOCIETY
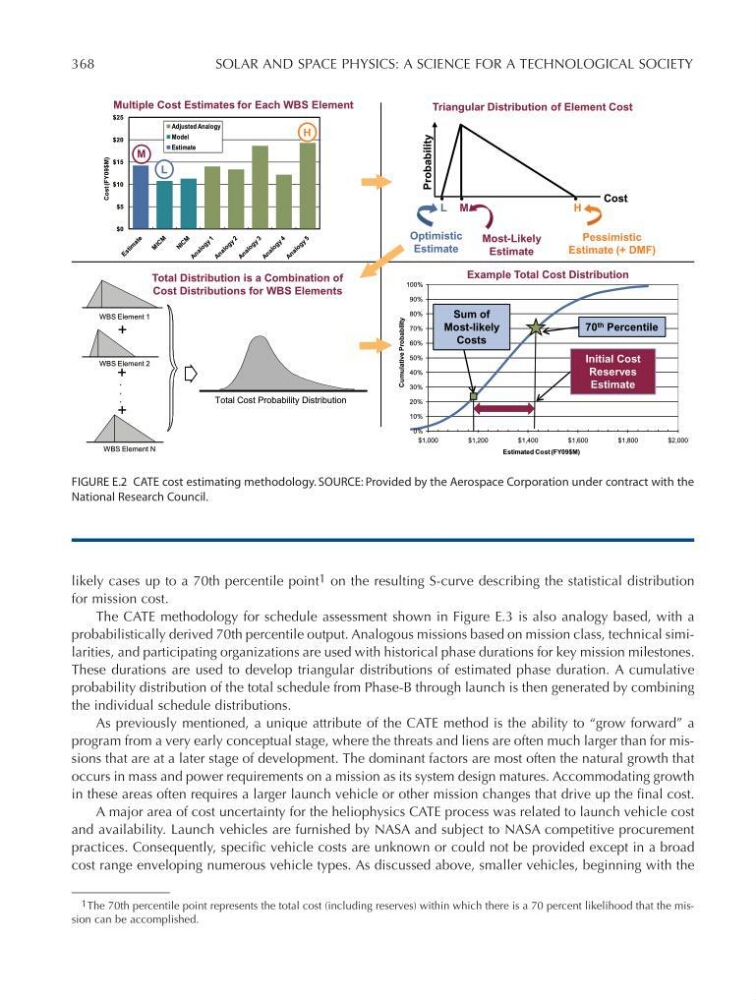
likely cases up to a 70th percentile point 1 on the resulting S-curve describing the statistical distribution
for mission cost.
The CATE methodology for schedule assessment shown in Figure E.3 is also analogy based, with a
probabilistically derived 70th percentile output. Analogous missions based on mission class, technical similarities, and participating organizations are used with historical phase durations for key mission milestones.
These durations are used to develop triangular distributions of estimated phase duration. A cumulative
probability distribution of the total schedule from Phase-B through launch is then generated by combining
the individual schedule distributions.
As previously mentioned, a unique attribute of the CATE method is the ability to “grow forward” a
program from a very early conceptual stage, where the threats and liens are often much larger than for missions that are at a later stage of development. The dominant factors are most often the natural growth that
occurs in mass and power requirements on a mission as its system design matures. Accommodating growth
in these areas often requires a larger launch vehicle or other mission changes that drive up the final cost.
A major area of cost uncertainty for the heliophysics CATE process was related to launch vehicle cost
and availability. Launch vehicles are furnished by NASA and subject to NASA competitive procurement
practices. Consequently, specific vehicle costs are unknown or could not be provided except in a broad
cost range enveloping numerous vehicle types. As discussed above, smaller vehicles, beginning with the
1 The 70th percentile point represents the total cost (including reserves) within which there is a 70 percent likelihood that the mission can be accomplished.
FIGURE E.2 CATE cost estimating methodology. SOURCE: Provided by the Aerospace Corporation under contract with the
National Research Council.
$0
$5
$10
$15
$20
$25
Cost (FY09$M)
Adjusted Analogy
Model
Estimate
Total Distribution is a Combination of
Cost Distributions for WBS Elements
Multiple Cost Estimates for Each WBS Element
+
+
WBS Element 1
Total Cost Probability Distribution
WBS Element 2
.
.
.
Optimistic
Estimate
Most-Likely
Estimate
Pessimistic
Estimate (+ DMF)
Probability
L M
H
Cost
Triangular Distribution of Element Cost
L
M
H
+
WBS Element N
0%
10%
20%
30%
40%
50%
60%
70%
80%
90%
100%
$1,000
$1,200
$1,400
$1,600
$1,800
$2,000
Cumulative Probability
Estimated Cost (FY09$M)
Example Total Cost Distribution
70 th Percentile
Initial Cost
Reserves
Estimate
Sum of
Most-likely
Costs
Figure E-2
Solar and Space Physics: A Science for a Technological Society
368
SOLAR AND SPACE PHYSICS: A SCIENCE FOR A TECHNOLOGICAL SOCIETY
likely cases up to a 70th percentile point 1 on the resulting S-curve describing the statistical distribution
for mission cost.
The CATE methodology for schedule assessment shown in Figure E.3 is also analogy based, with a
probabilistically derived 70th percentile output. Analogous missions based on mission class, technical similarities, and participating organizations are used with historical phase durations for key mission milestones.
These durations are used to develop triangular distributions of estimated phase duration. A cumulative
probability distribution of the total schedule from Phase-B through launch is then generated by combining
the individual schedule distributions.
As previously mentioned, a unique attribute of the CATE method is the ability to “grow forward” a
program from a very early conceptual stage, where the threats and liens are often much larger than for missions that are at a later stage of development. The dominant factors are most often the natural growth that
occurs in mass and power requirements on a mission as its system design matures. Accommodating growth
in these areas often requires a larger launch vehicle or other mission changes that drive up the final cost.
A major area of cost uncertainty for the heliophysics CATE process was related to launch vehicle cost
and availability. Launch vehicles are furnished by NASA and subject to NASA competitive procurement
practices. Consequently, specific vehicle costs are unknown or could not be provided except in a broad
cost range enveloping numerous vehicle types. As discussed above, smaller vehicles, beginning with the
1 The 70th percentile point represents the total cost (including reserves) within which there is a 70 percent likelihood that the mission can be accomplished.
FIGURE E.2 CATE cost estimating methodology. SOURCE: Provided by the Aerospace Corporation under contract with the
National Research Council.
$0
$5
$10
$15
$20
$25
Cost (FY09$M)
Adjusted Analogy
Model
Estimate
Total Distribution is a Combination of
Cost Distributions for WBS Elements
Multiple Cost Estimates for Each WBS Element
+
+
WBS Element 1
Total Cost Probability Distribution
WBS Element 2
.
.
.
Optimistic
Estimate
Most-Likely
Estimate
Pessimistic
Estimate (+ DMF)
Probability
L M
H
Cost
Triangular Distribution of Element Cost
L
M
H
+
WBS Element N
0%
10%
20%
30%
40%
50%
60%
70%
80%
90%
100%
$1,000
$1,200
$1,400
$1,600
$1,800
$2,000
Cumulative Probability
Estimated Cost (FY09$M)
Example Total Cost Distribution
70 th Percentile
Initial Cost
Reserves
Estimate
Sum of
Most-likely
Costs
Figure E-2